Linux Performance Tuning: Dealing with Memory and Disk IO
February 8, 2022
Linux is a general purpose operating system. This means it’s created to generally do what is right, instead of having specific code paths to perform what is right for a single specific task—and potentially be wrong for others.
Linux does not have tunable parameters for reserving memory for caching disk pages (the page cache), like operating systems such as HPUX (dbc_min_pct, dbc_max_pct) or AIX (minperm%, maxperm%). Instead, Linux uses all excess memory for its page cache. The linux page cache can be seen in /proc/meminfo with the statistic “Cached.”
A common mistake is to consider the /proc/meminfo statistic “Buffers” as the Linux page cache. The “Buffers” memory area is a memory area that holds raw disk data, meant as an intermediate buffer between processes, the kernel, and disk.
This blog goes into the details of how Linux deals with its memory and specifically its page cache. It explores how the availability—or lack thereof—can influence the performance of so-called “buffered IO”.
Buffered synchronous IO
Any normal synchronous IO operation that does not have special flags set when opening the file (descriptor) or doing a read or write will perform the following operations:
- For a read: the process will try to find the requested pages in the cache, and if not found perform the disk IO requests and then place the pages in the cache.
- For a write: the process will simply write to the cache.
This works great if processes or users perform small scale requests, and the operating system has a relative amount of cached pages/page cache available that is in line with the requests. This holds true in a remarkable amount of general cases.
Linux memory allocation
Linux works based on an allocation algorithm that most modern operating systems use, called “demand paging”. This means that any memory allocation or memory mapped read into memory is not actually performed when it’s executed. Instead, Linux waits until a process accesses a page, at which time the allocation or read will be performed. If such a page is requested and because of demand paging not found, a situation occurs that is called a “page fault”, which will force the kernel to make the page available. This happens for each single, individual memory page.
This can very easily give the false impression that a certain allocation size of memory is okay, because when a given allocation hasn’t been accessed, it’s not allocated. Certain databases can prevent this false impression by “pre-paging.” This means the allocating process is requesting all the allocated pages after the allocation. It forces the operating system to page it in via the earlier described method of page faults.
Linux free memory
Linux is designed not to keep free memory, except for an amount derived by the Linux kernel parameter “vm.min_free_kbytes”. Any free page beyond that value (pages_high, see below) will be used as page cache if not allocated for anything else. That doesn’t mean you will never see lots of free memory. You’ll see it just after startup before processes begin allocating memory, and after explicit freeing of previously-allocated and used memory.
In general, it’s normal not to see large amounts of free memory. A Linux system is considered healthy if the amount of free memory is around the size set with vm.min_free_kbytes.
Normally, Linux will use a method of three thresholds for free memory management, based on the setting of vm.min_free_bytes:
- pages_high (pages_min + (pages_min/2))
- pages_low (pages_min + (pages_min/4))
- pages_min (vm.min_free_bytes / 2^2 — in the code: vm.min_free_bytes >> (PAGE_SHIFT-10); this calculates the page size, so pages_min is vm.min_free_bytes in 4K pages)
This is initialized in __setup_per_zone_wmarks in mm/page_alloc.c.
In reality, the thresholds are set up per memory zone. However, for the sake of providing an overview of the principle, you can see this mechanism as a general system-wide threshold.
A bit simplified, the essence is:
- vm.min_free_kbytes sets pages_min
- pages_low and pages_high are set as different, higher thresholds based on and relative to pages_min.
- If the system wide amount of free memory gets below pages_low, the kernel page daemon (called “swapper” or swapd) starts scanning memory to free memory. It does so until pages_high, the amount of pages scanned by the kernel page daemon is visible in the statistic pgscan_kswapd, and the amount of pages freed is visible in the statistic pgsteal_kswapd (so the efficiency can be calculated via steal/scan).
- If system-wide memory allocations cross the pages_min threshold, memory pressure is considered high. Processes that request memory have to perform scanning for usable pages and stall execution. The amount of pages scanned by processes are visible in the statistic pgscan_direct, and the amount of pages freed is visible in the statistic pgsteal_direct. The number of direct page reclaim occasions per type of memory is visible with the “allocstall_*” statistics.
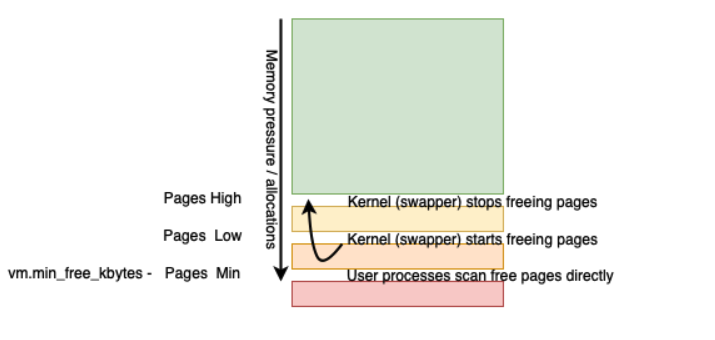
Figure 1. Kernel pages limits
If the amount of free pages gets below pages_low, the swapper starts scanning memory for free pages, and does so until pages_high. If the amount of free pages gets below pages_min, user processes need to find memory directly, along with the swapper scanning.
Immovable memory
As described with “linux memory allocation,” Linux and other modern operating systems perform many clever optimizations to utilize a computer system as efficiently as possible.
A lot of memory can easily be reused or repurposed. Cache memory are pages that are a copy of a block on disk, and therefore can easily be reused for something else. If that page is needed again later, it can be read from disk again. The same is true for memory-mapped files, such as executables and libraries: if there are no active users of a page, it can safely be flushed. The only downside is that if it is used again, it must be read from disk.
However, there are two noteworthy types of memory allocations that are hard to move:
- Dirty pages—or alias writes to the page cache not yet written by the kernel background writer thread—cannot be discarded or the filesystem will be corrupted. If swap is used, it also doesn’t make sense to move these to the swap device. Instead, these should be written to their destination. It doesn’t make sense to write these to swap first and read them later for the purpose of being written to their final destination. This means the only way to remove dirty pages is to write them to the actual files for which they store the change.
- Anonymous memory allocations are allocations of memory that contain operational data in use (they must be in use because of the demand paging mechanism), and do not have a backing file. This means they cannot be discarded or the process that has allocated them will get a protection failure when it tries to use such a discarded page, resulting in memory corruption. This is why anonymous memory cannot be discarded and repurposed. When swap is enabled, anonymous pages can be swapped to the swap device.
Memory allocated by PostgreSQL is partially allocated upon connection/backend creation (i.e., each backend needs a certain amount of memory to run as a process and run the PostgreSQL code) and partially on runtime during statement execution for data gathering, manipulation, and buffering. The runtime allocations can be very spiky and random in size, depending on the transformations and amount of data read.
Linux buffered write performance and latency
Linux buffered writes are dependent on available memory for cache, and a number of settings. In principle, a write is done to cache and therefore acts on memory speed, which is approximately 9,000 nanoseconds on a system with no CPU pressure (as seen on a Amazon c5.large VM using the fio latency data).
What happens in the case of a buffered write is that the userland process is performing a normal write system call, and doesn’t need to do anything special. The most important indicator that the write is done to cache is the latency of the write call. Such a write is written from the perspective of the userland process, but pending from the perspective of the kernel and in reality since the write sits in memory. A write error for pending writes cannot be detected because the original write call has no relationship with it anymore.
The kernel adds the written pages to a list of “Dirty pages,” and obviously must write these pages to disk to actually persist and truly finish the write. The writes are done by a kernel thread in principle independent from the userland process, visible as a “kworker” thread. If the write causes the amount of free memory to cross the pages_low threshold (because the dirty pages use memory to be stored), the swapper can be seen getting active to scan the memory to free pages within the thresholds mentioned earlier.
Dirty pages kernel ratios
However, writes cannot be done to cache/memory in an unlimited way. The amount of dirty pages in a system is generally limited by the kernel parameters vm.dirty_background_ratio and vm.dirty_ratio. These parameters have sibling parameters vm.dirty_background_bytes and vm.dirty_bytes. They allow setting these thresholds as a number of bytes, which are set to the default value of zero.
These ratios are the source of a lot of confusion. Contrary to general belief, these ratios are a ratio of available memory, not total memory. This distinction is important, because the available memory decreases when memory gets allocated and processes page memory into their address space. This might end up being very small, which means the dirty ratios might mean small amounts of pages.
This could be a problem if the write performance is tested on a system with lots of memory available. For example, when a database has just started up and hasn’t allocated much of its heap. In this scenario, the dirty percentage means a lot of memory, and thus writes are mostly done to memory. However, once the database and its processes are allocated and paged in their needed memory, the percentage then might mean a much lower threshold.
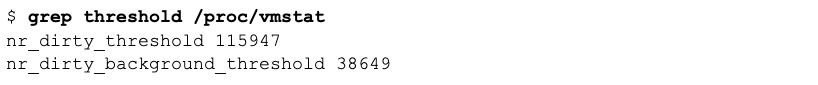
The absolute current size of the dirty thresholds expressed in pages can be seen in /proc/vmstat with the statistics nr_dirty_threshold and nr_dirty_background_threshold.
eatmemory tool: https://github.com/fritshoogland-yugabyte/eatmemory-rust
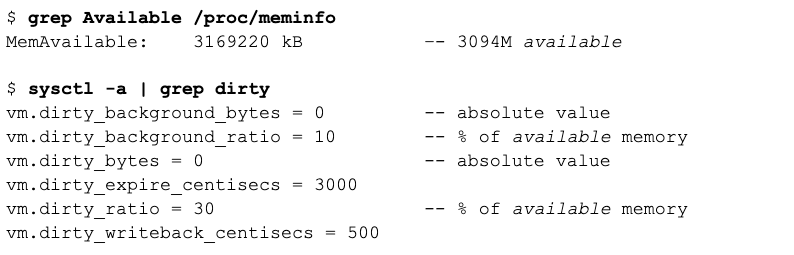
- 3169220 (available) / 4 (pagesize) / 100 * 10 = 79230 pages is the threshold for triggering the background writer to start writing dirty pages.
- 3169220 (available) / 4 (pagesize) / 100 * 30 = 237690 pages is the threshold for blocking writes to prevent from getting flooded with dirty pages.

The /proc filesystem also contains the current thresholds. Because this all is fully dynamic, these values will deviate a bit, but it’s clear these are very close; the dirty threshold is 236996 (pages 4K) = 926M, and the dirty background threshold is 78998 (pages 4K) = 306M.
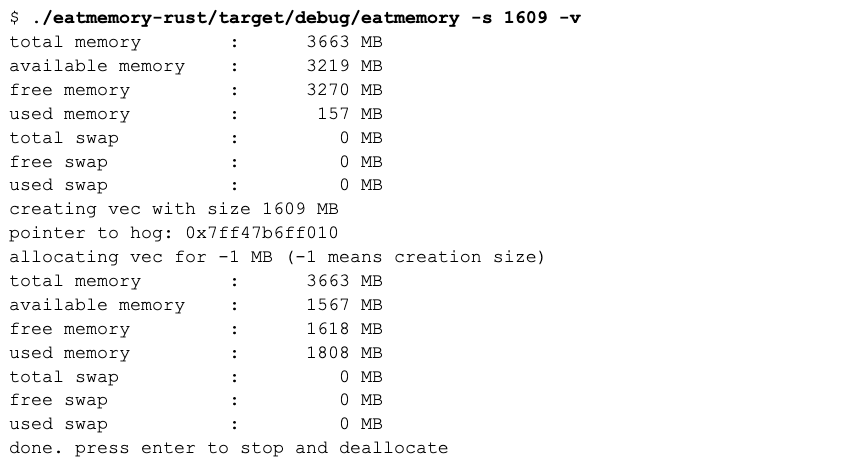
Now let’s simulate an executable taking 85% of available memory:
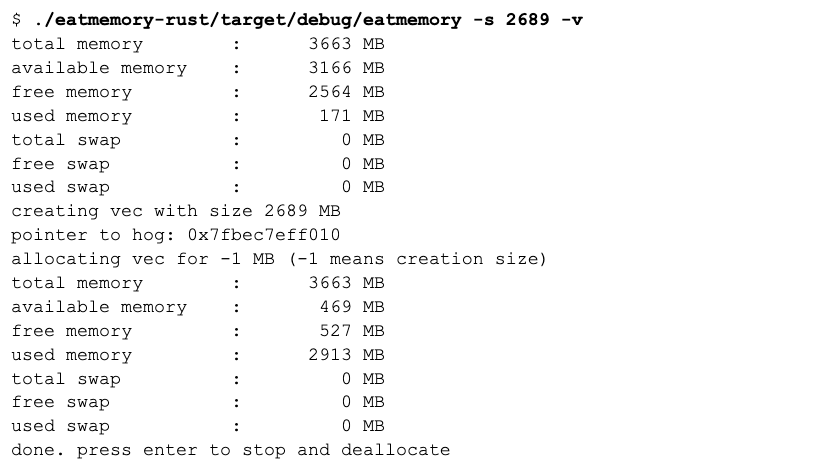
This shows that prior to “eating” the memory, the available memory was 3166M, and after allocating the memory, the amount shrunk to 469M.
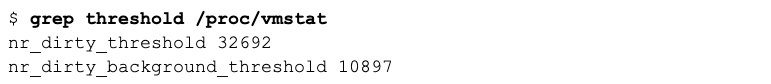
This shows that the dirty thresholds do change dynamically with available memory. The dirty threshold now is 32692 (pages of 4K) = 128M, and the dirty background threshold is 10897 (pages of 4K) = 42M.
Dirty ratios and write performance
It’s been demonstrated with the dirty pages kernel ratio that the thresholds do get lower when the amount of allocated memory decreases. However, does that influence buffered write performance, and if so, how much?
Situation 1: no excessive memory allocations
The first test is executed at a size deliberately smaller than the dirty background threshold.

Write bandwidth was 1802MBPS, average latency 3.6us, and no physical writes done (0). The total amount of pages for writes fit in memory. The writing process was not halted and wrote the pages at memory speed.
The second write test is done with a size that is 50% of total memory.
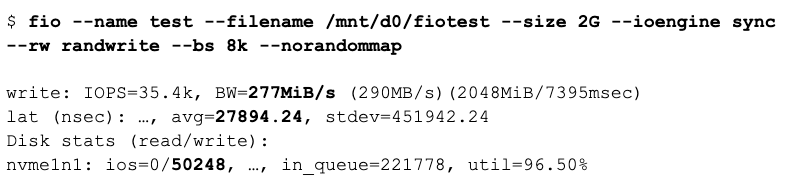
Write bandwidth was 277MBPS, average latency 27.9us, and physical writes were performed as a result of this write batch (50248). The writes triggered the background writing, and fio got halted to prevent from generating too many dirty pages, which resulted in higher write latency.
The third write test is done with a size that is 150% of total memory.

The write bandwidth went down to 39.5MBPS, average latency 197.6us, and obviously lots of pages are written because of this batch. Since this generates more dirty pages, the write batch had to wait longer for memory to become available to write into, which is made available as soon as the background write threads have written the page.
Situation 2: 50% of memory allocated
By allocating 50% of 3219 the available memory has gone down to 1567M. A quick check on the dirty thresholds:
That’s 150M for the background writer threshold, and 453M as the dirty threshold.

The 200M write batch still performs at 3.7us because no actual writes were performed. This is understandable, because the size of the write batch is 200M, and the dirty threshold is higher.
Now, let’s look at the second test with a write batch size of 50% of total memory, which is 2G:
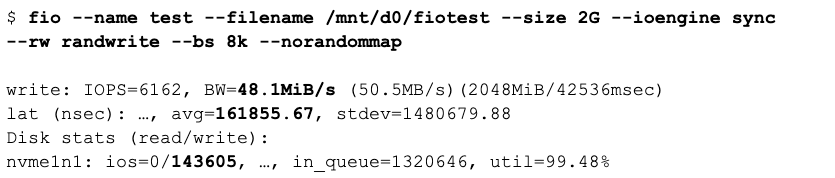
The write bandwidth came down to 48.1MBPS from 277MBPS with no memory pressure. This happened because the amount of memory that can buffer and cache the writes was lower. The main culprit for the lower bandwidth is the average write latency that has gone up from 27.9us to 162us.
And for the third test at 150% of memory, which is 6G:

This test shows that when writing much more than the available memory and the thresholds, the bandwidth goes further down. This happens because the writing has to wait for dirty pages to write to disk, and by increasing the write batch size, the latency goes up because a greater amount of pages has to wait, instead of being satisfied by only writing to memory.
Situation 3: 75% of memory allocated

With 75% of memory taken, the available memory is down to 734MB. The thresholds are:

That means that the background writer threads are triggered at 72MB, and the dirty threshold is at 217MB.

Now with 85% of memory taken, the dirty threshold seemed to suggest that the write batch of 200M would fit into memory. However, the writing did get stalled, resulting in the average write latency going up from a little less than 4us to 16.3us, which had a huge impact on the bandwidth, which went down to 459MBPS from previously way over 1GBPS.
The second test with a write batch size of 2G:
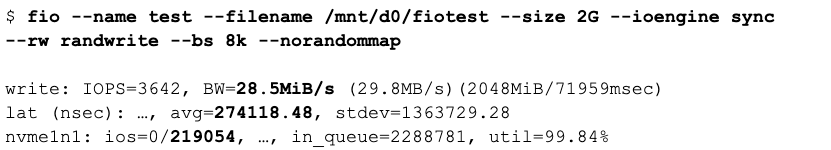
Not unsurprisingly, the size of the batch of 2G means we cross the thresholds and therefore must wait for the dirty blocks to be written. Because the available memory for dirty blocks has significantly been reduced, the writes are significantly throttled, and thus the bandwidth went down to 28.5MBPS because the average latency has been increased to 274us.
The third test is performed with a write batch size of 6G:
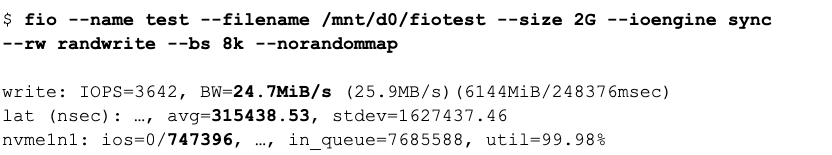
The test with 6G shows a further decline in bandwidth to 24.7MBPS from 28.5MBPS with 50% memory taken. With the write batch size much higher than the amount of memory that can hold dirty pages, the latency of the buffered write slowly moves towards the physical write latency.
Write performance conclusion
What can we conclude from the above measurements?
The above measurements are measurements of a single process performing buffered write IOs in isolation on a virtual machine. In real life, it’s likely multiple processes are performing both read and write IO requests at the same time, and thus for IOs to get queued because they arrive at the same time. So the above measurements are likely to be more optimistic than reality.
If you want to have stable, predictable buffered write performance, there should be a significant amount of memory to be “available” so writes performed can take memory pages to store the write. Having a significant amount of memory as available memory makes the dirty threshold to be high enough not to force a writing process to get halted to balance the amount of dirty pages and thus indirectly wait for the kernel writing threads.
If you think about the basic, general idea behind the (write) cache, it’s not too hard to see the design is made to cater for many small IOs at a fairly low scale, which means the rate of reads and writes can be contained in the available memory. Larger scale IO doesn’t play nice with this mechanism. Write IO requests get stalled, and latency “spontaneously” goes up from near memory speed to near disk IO speed.
Not having sufficient memory available will make a writing process push the number of dirty pages beyond the global system threshold, making every buffered write in such a situation to get stalled because of the kernel limiting the amount of dirty pages. This can have an escalating effect on systems that are write IO heavy and increase IO times.
The essence of these measurements should not be new to anyone. Any time you use a cache, and the cache usage exceeds the cache capacity, the performance will lower to the performance of the point that is the next bottleneck.
Down the rabbit hole: measuring kernel write throttling
The reason for threads waiting for writes is kernel write throttling, not waiting for the storage device to signal an IO is written. This mechanism tries to keep the number of dirty pages below the dirty threshold. As a result, it avoids processes having to physically write to disk directly to lower the rate of dirty page generation so the kernel threads can keep up and quickly write out dirty pages.
This mechanism is taking place in the Linux kernel function balance_dirty_pages()
The balance_dirty_pages() function is called for any buffered write and signals the writeback (kernel) threads if the background threshold is crossed. It adaptively throttles writes if the amount of dirty pages is higher than (dirty background threshold + dirty threshold)/2 (see the comments with the balance_dirty_pages() function).
Throttling is not visible in a common Linux statistic, the kernel log file (/var/log/messages), or the dmesg output. However, it can be monitored using a perf record event: perf record -e writeback:balance_dirty_pages –filter ‘pause > 0’. After recording, the ‘perf script’ utility can be used to view all occurrences of throttling applied by the kernel.
Linux buffered read performance and latency
Linux buffered reads are dependent on available memory for cache, and pages already cached requested by read calls. Obviously, when pages already exist in the page cache that are requested, these do not need to be read from disk again, and thus removes the overhead and latency of requesting these from a block device. The cache is completely dynamic and essentially consists of memory that is not allocated by the kernel and the processes. This makes it hard to predict the exact size of the page cache. When there is memory pressure, typically the page cache is the first type of memory that gets reused. This means that over-allocation of memory will minimize the page cache to a minimum.
For writes, there are the dirty ratios and bytes settings. And for reading, there are no direct settings (vm.vfs_cache_pressure is related, but is a setting for the cache balance between page cache and dentry and inode caches).
Linux has a complex page cache architecture, which sits in its own layer (vfs, virtual filesystem layer). It combines different pages and types of requests, such as memory mapped pages (i.e., mmap()). Memory mapped pages are part of the cache as well as data read that is not directly mapped to a process after the call. The global size of the page cache can be seen in /proc/meminfo as “Cached”, which is not equal to all actual page cache data. It also contains (memory mapped) pages from executables and libraries.
(Non dirty) pages in the cache are placed there by the requesting process or thread, and can be reclaimed without any issue because they represent an equal page on disk. The reclamation of pages happens by the kernel page daemon (swapper) when the amount of free memory drops below pages_low or a userland process; when the amount of free memory drops below pages_min, see Linux free memory. A special notion for /proc/sys/vm/drop_caches, which can be used to free caches manually.
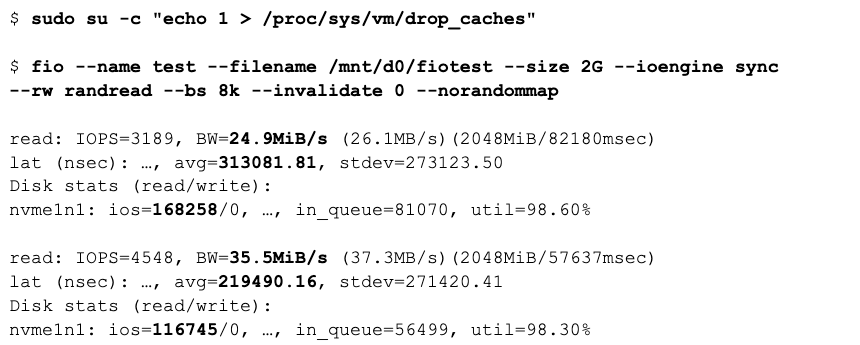
Situation 1: no excessive memory allocations
The first run is using a size of 2G. Please mind the cache is flushed, so the first run must obtain most of the data from disk. The norandommap switch makes the IOs truly random, so it’s possible that the first run already requests a page that has been read before.
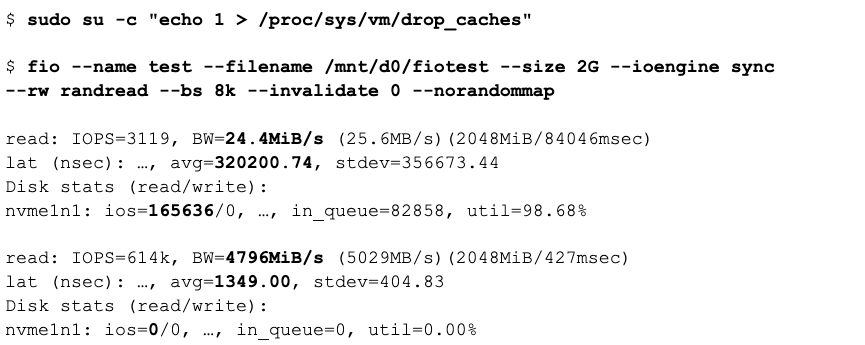
Fio reads 2G in 8k chunks. The flag invalidate flag set to 0 means that fio does not flush the cache for the file requested, and thus can take advantage of already cached pages. It is primarily meant for the second run, for which the intention is to show the latency and performance of a cached read request.
The second run can take advantage of the cache being filled and can reach a huge bandwidth (+4G/s!). It does this because no actual physical IO requests are performed (0 on the last line), and the average latency is down to 1.3us.
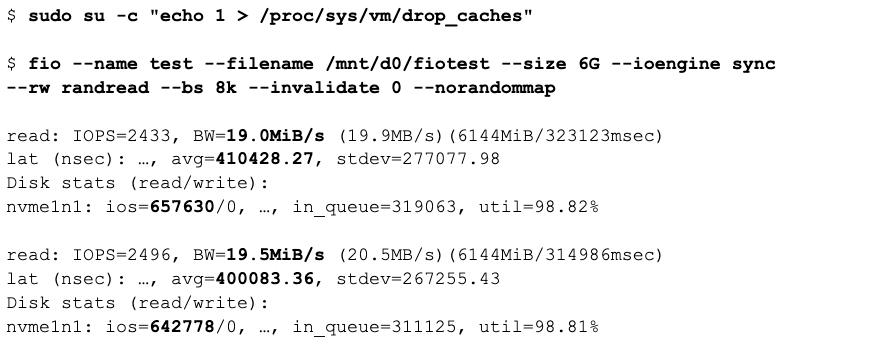
The second run is using a size of 6G. This is more than the available memory in the system, so it cannot cache all the pages.
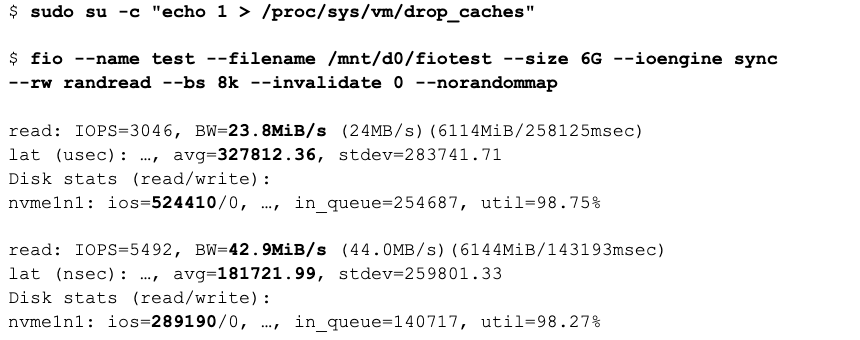
The first run needs to read everything from disk again, but now cannot keep everything in the cache. That means that even the first run will have less cache hits, and thus has a slightly higher average latency than the first run of 2G (320us <> 327us).
The second run must perform a lot of IOs to fetch data from disk, although it started with a warmed cache. Starting with a warmed cache is the difference between the first run and the second run. The second run performing IO requests influenced the average latency which went up to 182us versus 1.3us of the fully cached run, which also influenced the bandwidth.
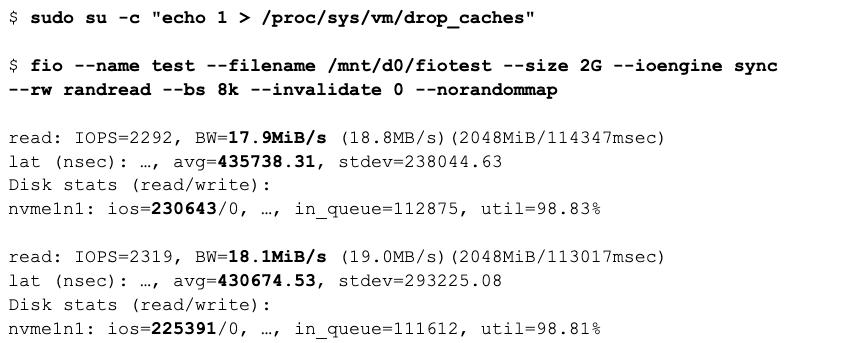
Situation 2: 50% of memory taken
For taking memory, the eatmemory utility is used again.
With 50% of memory taken, the 2G of pages cannot be kept fully cached, and thus the second run now has to perform disk IO. This increases the latency significantly, and changes the average read latency of the second run from 1.3us to 219us, and thus the bandwidth.
For the test with 6G, the ability to cache is worse because the write batch set size is larger. This reflects itself in the average latency, which goes up to 410us for the first run, and is marginally better for the second run.
Situation 3: 75% of memory taken
For the 75% memory taken scenario, eatmemory is used again. That means the memory that can be used for caching is further decreased.
The situation of 75% memory taken increases read latency in both runs. The first run can take advantage of some caching if enough memory is available. However, with much lesser memory available it hardly can, which means the latency goes up from the 50% case: 436us versus 313us, lowering the bandwidth.
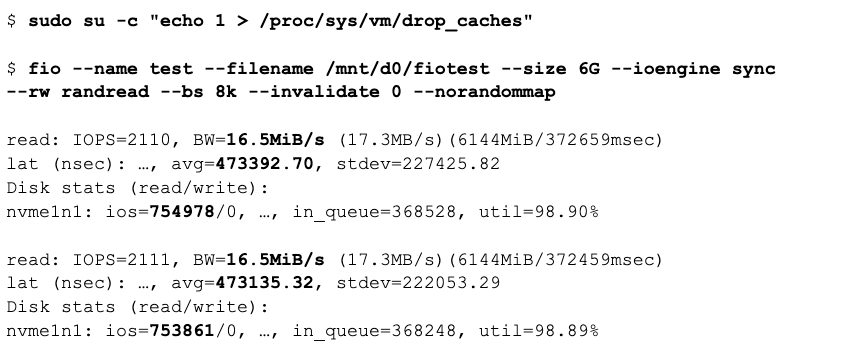
The situation of 75% memory taken and having allocated a lot of memory now totally beats the cache. The first cold cache run has no actual bandwidth advantage anymore. Both take the same bandwidth.
Requesting too much data removes the advantage of the cache.
Deeper down the rabbit hole: kernel read-ahead
There is another phenomenon that can take place on Linux, which is kernel read-ahead. The downside is there are no statistics indicating this is taking place, unless you add a kernel probe to obtain the kernel activity that performs this work.
Take a closer look at the following fio run. We changed the –rw switch to “read”, which means the file is sequentially scanned. As a result, it only scans every page in the 2G file once, so it cannot take advantage of caching:
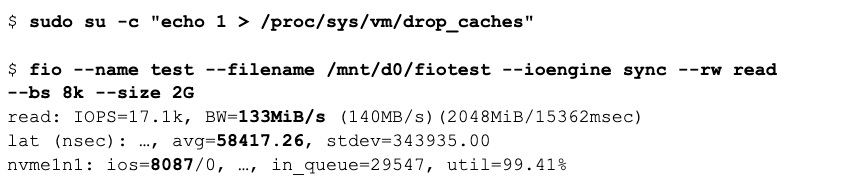
We once again first flush the cache: no data is cached, so every page must come from disk.
The fio run gives a hint something is going on by looking at the bandwidth: the previous random read jobs gave a figure of around 24MBPS, which already included some caching. This scan is performing at 133MBPS: that should not be possible.
The second hint is the latency: the average latency is 58us, while the random read scan reading from cold cache had a latency of around 320us.
The final and most clear hint is the number of IOs: the fio scan is performing 8K reads. The amount of reads of 8K to scan a 2G file is 262,144. Yet the amount of physical IOs is 8087!
It turns out there is a mechanism in the Linux kernel that detects threads sequentially reading a file. It acts on it by dynamically increasing the read size and filling the page cache with the read pages. Therefore, when requesting the thread request for the next (expected) range, it can serve them from the page cache.
This happens in the Linux kernel function ondemand_readahead. This functionality does not hit any statistic, nor does it leave a message in /var/log/messages or dmesg. It also doesn’t have a kernel trace point. However, this mechanism can be measured by creating a perf probe on the function (perf probe ondemand_readahead) and then using perf record -e probe:ondemand_readahead and perf script to see the recorded probe hits. The kernel readahead mechanism dynamically scales up the readahead during the sequential scan. This is why the mechanism is more efficient with bigger scans. The size of the requests increases to the set maximum IO size for the device (/sys/block/<DEVICE>/queue/max_sectors_kb).
Read performance conclusion
The conclusion of the performance of buffered reads is pretty much the same as buffered writes. The kernel provides a smart caching system that aids performance quite significantly. However, this only happens if enough space is available for the kernel memory to keep pages cached. Another requirement is for the total concurrent requests and request sizes to not exceed cache capacity.
Conclusion
When using Linux to serve an application using buffered IO where IO speed is critical to performance, the server memory size and the application memory usage must be tuned to allow the “active data set.” This is the overall size of the IO requests, which fits in the memory available to the page cache.
Linux does not allow fixing page cache properties. The only possibility is to ensure the applications and processes allocate an amount of memory that allows Linux to keep the page cache at the desired size.
Looking for an open source, distributed SQL database to pair with your Linux distribution? Explore YugabyteDB, the only distributed SQL database built to accelerate cloud native agility.


