Monitoring Change Data Capture (CDC) Using YugabyteDB’s Metrics Dashboard
January 5, 2023
Data in YugabyteDB can be streamed to various data lakes and sink databases using YugabyteDB’s Change Data Capture feature. The metrics in CDC provide an intuitive, visual way to monitor the health, performance, and progress of these CDC operations.
In this blog, we will explore how to set up the metrics dashboards for YugabyteDB’s CDC operations and how to use them to monitor those operations. We will also explore the behavior of these metrics under various scenarios.
Setting up the CDC Metrics Dashboards
The process of setting up the CDC metrics dashboard is simple. As a pre-requisite, Docker and Docker Compose should be installed and running. In addition, you can find a step-by-step guide on GitHub to set up a YugabyteDB CDC pipeline to get the data from the Yugabyte database to a Kafka topic.
We will use this guide’s quick start example where changes from YugabyteDB are streamed to a PostgreSQL database using a JDBC Sink Connector. Other examples of how to use YugabyteDB’s CDC are provided in the CDC Examples repository (also on GitHub).
To set up the metrics dashboards bring up the docker containers using docker-compose up and then deploy the connectors. The metrics dashboards are set up automatically in Grafana and can be accessed at port 3000 (ex: localhost:3000).
Important Health Metrics for YugabyteDB CDC
The important health metrics are:
- Change Event Count
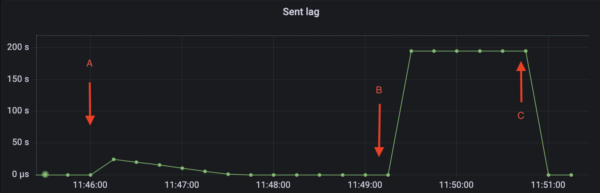
The Change Event Count metric shows the number of records sent by the CDC Service. - Sent Lag
The Sent Lag (or lag) metric tracks the difference between the rate of DML transactions and the rate at which the CDC client consumes the change events from those transactions. The LAG metric is calculated by subtracting the timestamp of the latest record in the WAL of a tablet from the last record sent to the CDC connector. When the CDC Connector is slower than INSERT/UPDATE/DELETE transaction rate, change event records start to accumulate in the database. The lag keeps on increasing until the client eventually catches up. If the client dies in the middle of operations, the lag will never drop down and will keep rising when DML transactions are executed in YugabyteDB. - Stream Expiry Time
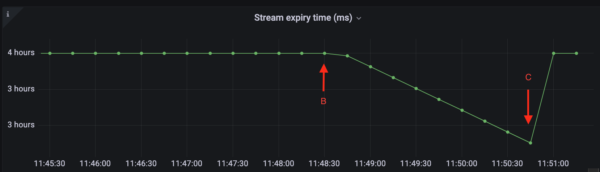
YugabyteDB retains records in WAL for a limited period of time. The retention period can be configured using cdc_retention_time_ms. Once the retention period expires, the events are garbage collected. If a CDC connector does not read a record within the retention period, the CDC stream is invalidated. The time left to read records from WAL is tracked by the Stream Expiry Time (ms) metric. When a CDC connector is slow or not running, the metric starts to decrease.
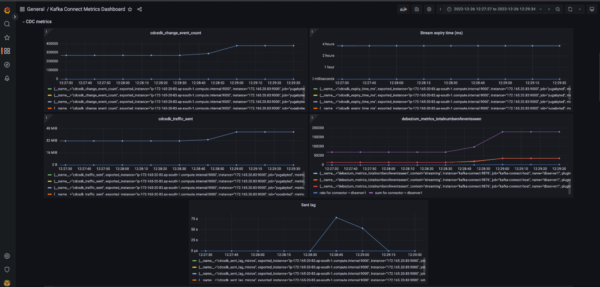
The figures below illustrate the behavior of these metrics when a connector stops.
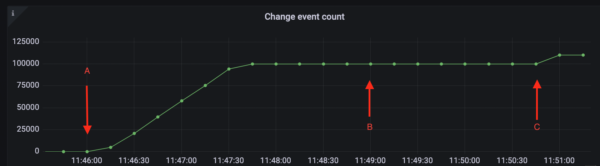
In the example illustrated in the figures above, a CDC pipeline was set up along with the metrics dashboards. At point A, DML transactions are executed in the Yugabyte database. The CDC Service starts streaming the change events for these DML transactions. In this example, there were 100k inserts performed.
Fig 1 illustrates the scenario using the metric Change Event Count. The metric starts to increase at Point A when the script to insert records was started. Once all the events have been successfully streamed the graph for Change Event Count plateaus.
At point B, the CDC connector is stopped. After it was stopped, another 10K records were inserted. Change Event Count does not change since the connector is not running. At the same time, the lag starts to increase (fig 2) since the change event records from the second batch of INSERT transactions have not yet been consumed. Similarly, Stream Expiry Time (fig 3) starts to fall.
At point C the connector was restarted. The second batch of 10k INSERT records is now streamed. Change Event Count starts to increase in fig 1. At the same time, Sent Lag (fig 2) quickly falls back to zero and the Stream Expiry Time (fig 3) rises back to its initial value.
Available CDC Metrics Dashboards
All the CDC metrics have been organized into the following dashboards:
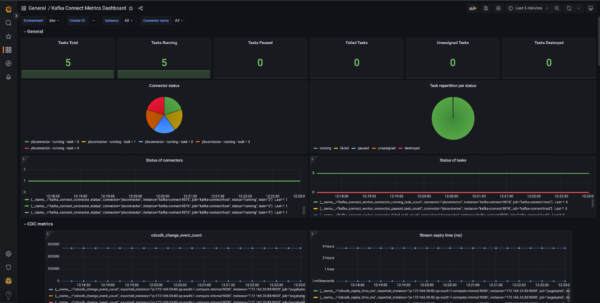
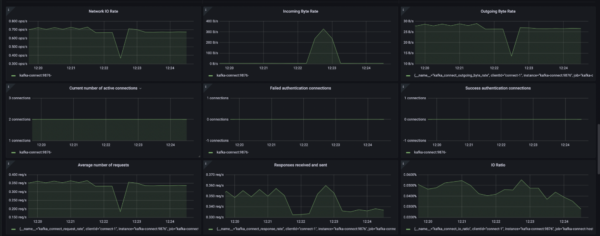
- Kafka Connect Metrics Dashboard
This dashboard contains all the general-purpose metrics relating to Kafka Connect Worker, System, Connectors, Tasks, and CDC. These metrics are grouped according to the aforementioned categories and arranged accordingly in their panels.
- Monitoring CDC Operations
This dashboard contains three metrics: total traffic in bytes sent to the sink, the total number of change events sent from the server side, and a metric for server side lag (in microseconds). - CDC Health
This dashboard provides metrics to monitor the health of the machine running the CDC as well as the health parameters related to the CDC. This dashboard has metrics for JVM GC, the expiry time of CDC stream, and connector queue-related metrics. - Snapshot Mode
This dashboard contains metrics for monitoring CDC when run in snapshot mode. It has metrics to show the total number of events sent, the number of tables being snapshotted, and the number of tables the snapshot has yet to copy. - Metrics Dashboard
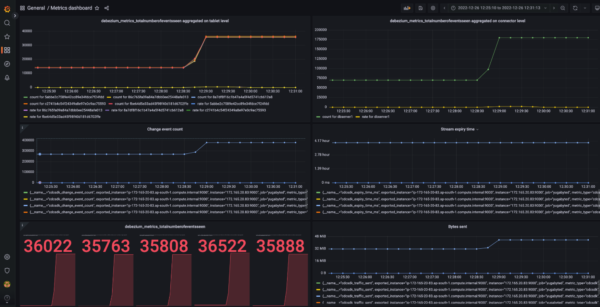
This dashboard, which is kept in the “General” directory in Grafana, contains all the CDC metrics (both server side as well as connector side). These metrics include:- change event count
- traffic sent in bytes
- server side lag
- time left for stream expiry
- metrics relating to the connector queue
Conclusion
This short blog explained how to set up the dashboards to monitor YugabyteDB’s CDC metrics. We also saw the behavior of these metrics in certain scenarios. These dashboards provide valuable information for monitoring CDC operations, performance testing and benchmarking, etc.


