YugabyteDB Log Tracing Made Easy with ELK Stack: A Step-by-Step Guide
March 16, 2023
Manually filtering through logs can be a frustrating and time consuming task, especially when dealing with large databases and trying to locate the right error message. However, with ELK you can parse your logs from each universe to consolidate them into a central location, simplifying the debugging process.
ELK (or the ELK Stack) refers to three open source projects—Elasticsearch, Logstash, and Kibana. Elasticsearch is the backbone of the ELK Stack. It is a distributed, RESTful search and analytics engine capable of addressing a growing number of use cases. It offers a centralized repository for your data for lightning fast search, fine-tuned relevancy, and powerful analytics that scale with ease. To install Elastic Stack you can follow the documentation located at elastic.com.
Continue reading this blog for a step-by-step guide on how to efficiently collect the desired logs from YugabyteDB to aid you in your system debugging efforts. But first, let’s cover a few of the other prerequisites.
- Kibana
- Filebeat
- Logstash
- YugabyteDB Anywhere
Kibana
Many components can be installed on top of Elasticsearch, with Kibana serving as the graphical user interface (GUI). Kibana accepts information from other systems running on the ELK Stack, such as Logstash or Filebeat, and presents it in a customizable manner. You can load metrics, logs, and system availability data and use analytical tools to explore, visualize, and analyze your data. To install Kibana please refer to the documentation located on their website.
Filebeat
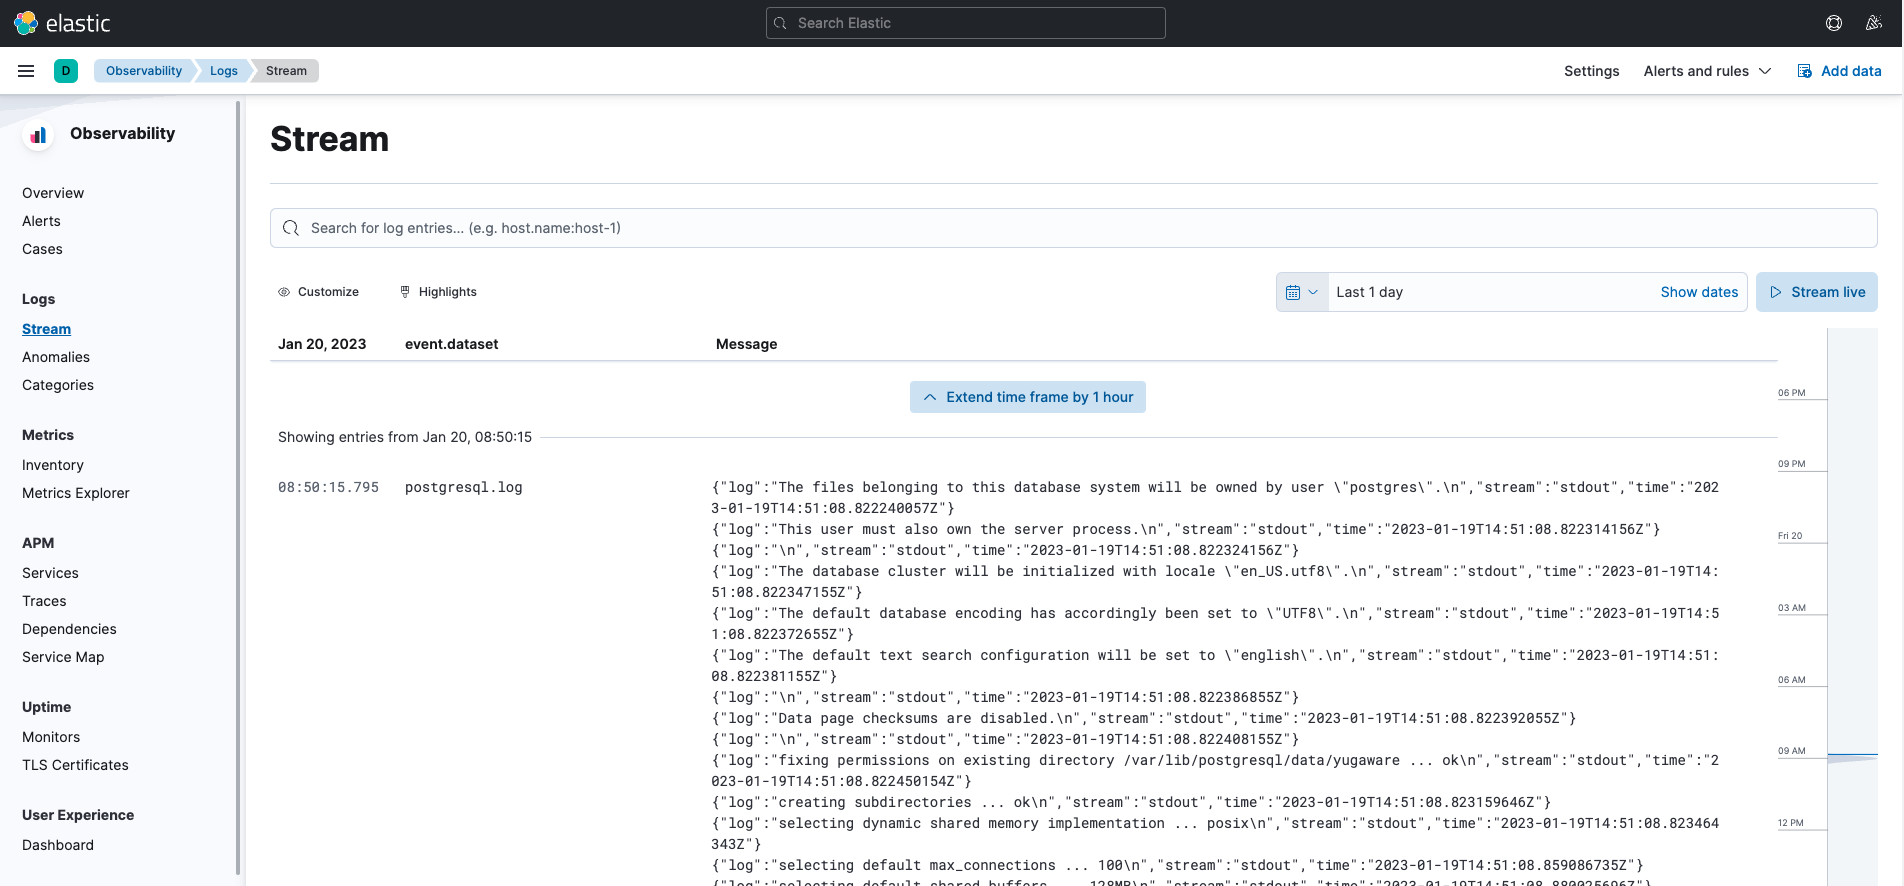
Filebeat is a lightweight shipper built with the ELK Stack that forwards and centralizes log data. You can install Filebeat pretty easily following instructions on the elastic.co website. In addition to the lightweight FileBeat log shipper there is a more complex, customizable, heavyweight option called Logstash. When using just FileBeat instead of Logstash the Kibana GUI appears as the image below—like a standard PostgreSQL log file into Kibana. Click on “Live Stream” in the top right hand corner to review logs in real time.
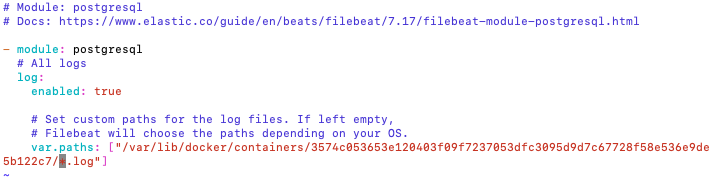
Configuring FileBeat is straightforward. You only need to provide a local path to collect the logs. The PostgreSQL path from our YugabyteDB Anywhere Docker Container is: </etc/filebeat/modules.d/postgresql.yml>
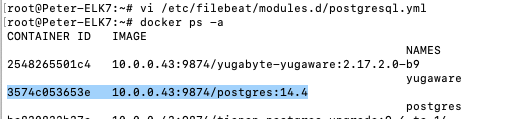
Tip #1: The Docker Container UUID will be different on your system. To locate it you can follow these instructions:
Locate the PostgreSQL Container by running a <docker ps -a> and you will see it as in the image as (see blue highlight):
You can then find the right container in </var/lib/docker/containers/> with the matching UUID from above.
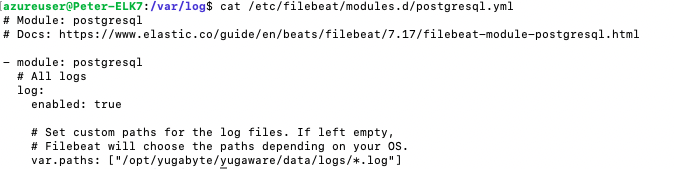
Tip #2: YugabyteDB logs are the logs from the YugabyteDB Anywhere VM. These logs consist of a time stamp, different log levels, and information from across the cluster. With distributed systems it can be hard to look through these logs to pinpoint the message you need to debug your issue. Therefore, here is an example of the configuration file used to retrieve the YugabyteDB Anywhere log files (postgresql.yml):
Logstash
Filebeat is utilized by Logstash to gather data. You might be wondering about the distinction between the two, or which one is more suitable for your specific use case. Essentially, Filebeat is responsible for data collection, while Logstash performs in-depth analysis of your log files by filtering the content using GrokStyle expressions. It’s worth noting that Logstash relies on Filebeat as a prerequisite. To begin using Logstash, you can refer to the installation instructions available on elastic.co.
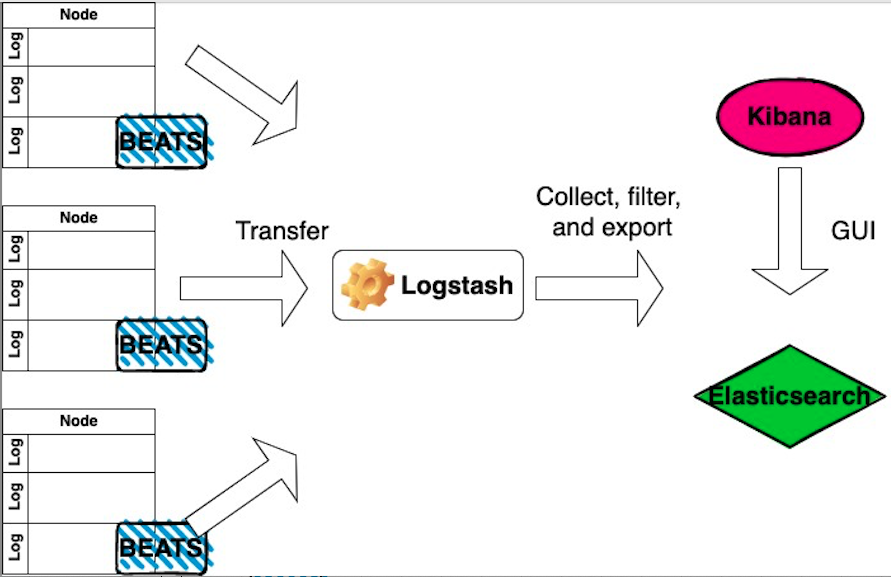
With ELK and Logstash you can configure your environment to grab the logs from “beats” and pass it to Elasticsearch.
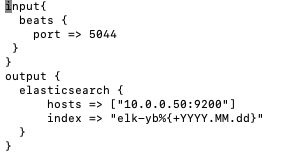
There’s one more small step. You need to create a yugabyte.conf file to tell Logstash to retrieve the necessary information from Filebeat. You have to create a file manually that should be placed in the Logstash directory, specifically in the </logstash/conf.d/> location to keep all your <.conf> files in the same location.
Here is an an example of the yugabyte.conf without a Grok filter:
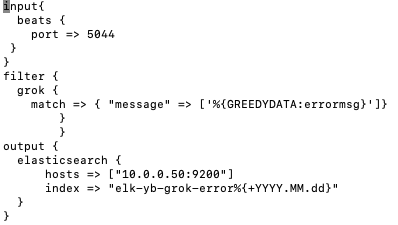
Now here is an example of the yugabyte.conf that does include a simple Grok filter for error messages:
Here is how the output appears in Kibana:
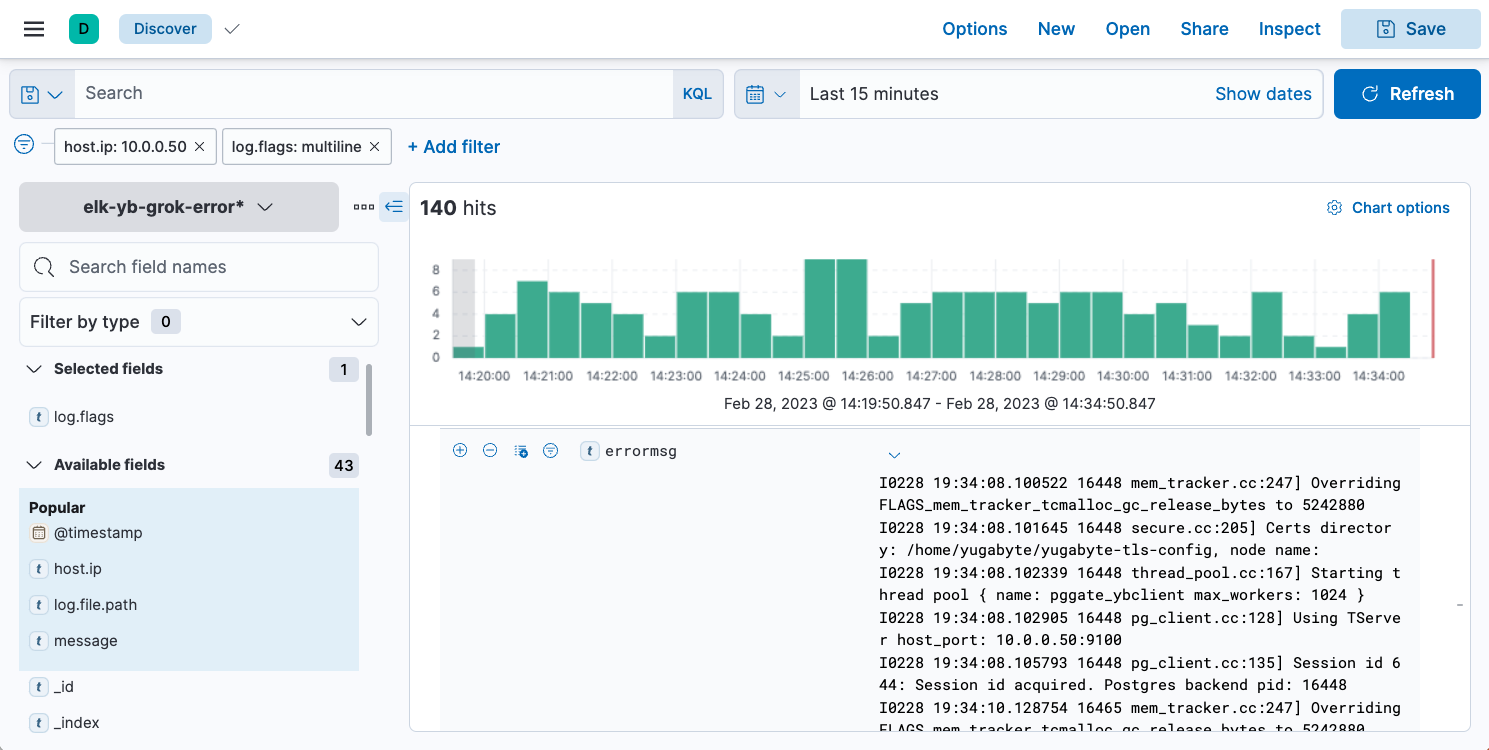
The above image shows how the index pattern used to search for <errormsg> within the Yugabyte logs would appear in the Kibana GUI. Two really great features are the custom filter fields on the left and the ability to search by a specific date and time in the top corner. Next we selected the node IP address and searched for log.flags field. This way we can analyze our system and inspect the log files without having to manually filter out debug levels such as info and warning. NOTE: In this example, I shut down one node in my cluster so I can simulate an error message being passed into ELK.
Conclusion
We have evaluated and executed both approaches for shipping logs into ELK by using Filebeat or Logstash. Rather than concluding with a general summary of what you just read, we encourage you to leverage this blog as a starting point to investigate the integration of the YugabyteDB database with the ELK stack, and for analyzing the log files of the Yugabyte platform and universe log files.


