How to Build Centralized Observability in Dynatrace for YugabyteDB Audit and Query Logs

November 10, 2026
While the YugabyteDB Anywhere dashboard provides comprehensive visibility, organizations managing larger portfolios often prefer a unified observability platform.
Earlier this year, YugabyteDB Anywhere introduced direct integration to various observability and monitoring tools, such as log export to Datadog, Splunk, AWS CloudWatch, GCP Cloud Logging, and Metric export to Dynatrace (detailed in this blog).
With the release of YugabyteDB Anywhere version 2026.1, native OpenTelemetry Protocol (OTLP) support is a game-changer for observability workflows, enabling seamless export of logs and metrics to any OTLP-compatible receiver via the standard OpenTelemetry wire format.
The OTLP sink is vendor-agnostic and works with any backend that speaks OTLP, including (but not limited to) Cribl, Grafana Cloud, New Relic, Prometheus (3.0+), VictoriaMetrics, and Sumo Logic. You can reuse the same OTLP telemetry provider for query and audit logging, database metrics export, or both.
In this blog, we demonstrate how to build a unified Dynatrace dashboard that acts as a centralized command center for monitoring “slow queries” across all your clusters. We will share how organizations can harness these capabilities to continuously monitor slow queries across diverse environments, pinpointing latency bottlenecks and performance regressions before they affect end users.
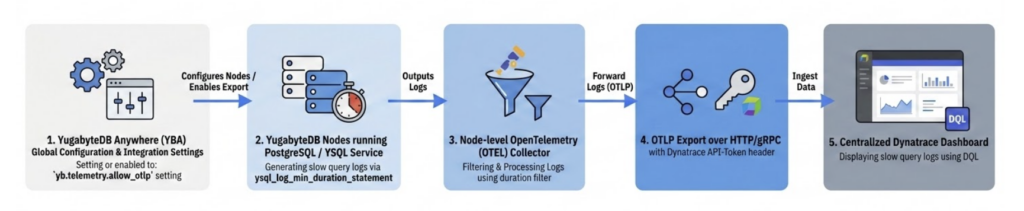
Step 1: Enabling OTLP Exporter in YBA
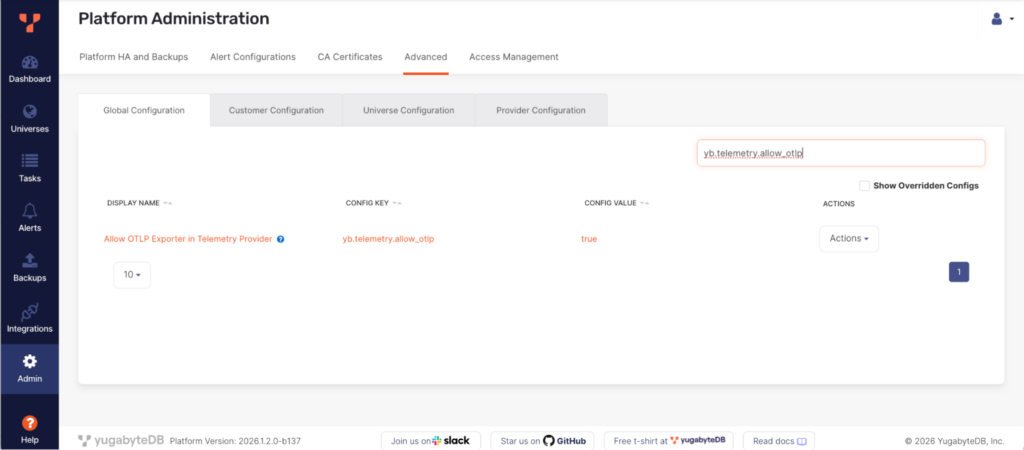
In versions earlier than v2026.1.2.0, set yb.telemetry.allow_otlp to true to use OTLP. Starting from v2026.1.2.0, OTLP is enabled by default.
- Navigate to YBA → Admin → Advanced → Global Configuration.
- Search the config key:
yb.telemetry.allow_otlp - Enable the configuration via Actions ▽
Step 2: Creating OTLP Export Configuration
Set the destination for your telemetry data.
- Navigate to YBA → Integrations → Log and Metrics Export → + Add Configuration
- Choose the OTLP export type and enter the following details as shown below.
Export Configuration Name:
Please give a desired export configuration name.
Export to:
Here choose OTLP
Endpoint URL:
The publicly accessible OTLP endpoint URL of your Dynatrace instance. The endpoint URL is the URL of your Dynatrace instance.
https://{your-environment-id}.live.dynatrace.com/api/v2/otlp
Note that if you copy your Dynatrace environment ID from the browser address bar, make sure to remove .apps and replace with .live.
Protocol:
When configuring an OTLP telemetry provider in YugabyteDB Anywhere, you can choose between two protocols: gRPC and HTTP.
Choose gRPC (the default) if:
- Your receiver accepts OTLP over gRPC and one endpoint for both logs and metrics is enough. gRPC is the default in both the UI and the YBA CLI.
- You don’t need per-signal endpoints. A gRPC provider that sets Logs Endpoint or Metrics Endpoint is rejected.
Choose HTTP if:
- Your receiver exposes OTLP over HTTP only, or you want to use HTTP endpoints.
- You need different URLs for logs and metrics. The optional Logs Endpoint and Metrics Endpoint overrides (for example,
https://example.com:4318/v1/logsandhttps://example.com:4318/v1/metrics) are available only with HTTP. - If you choose HTTP, note that the collector appends
/v1/logsto the configured endpoint when log export is enabled. Don’t include that suffix in the endpoint unless you use the explicit Logs Endpoint override.
Authentication Type:
For an OTLP export configuration, you can choose the following authentication types:
- No Auth (default): no credentials
- Basic Auth: username and password
- Bearer Token: a token
- Custom Headers: Allow custom authorization header
Dynatrace allows authentication through The Api-Token Scheme (Classic/Environment APIs) and The Bearer Token Scheme (Latest Platform & Account APIs that strictly enforce OAuth 2.0 authorization).
Here, we have chosen Custom Headers for Dynatrace authentication, so we can authenticate the Dynatrace endpoint using a custom Authorization header with the API Access Token scheme. Please refer to the screenshot below.
Header Name: Authorization
Header Value: Api-Token {API-access-token-string}
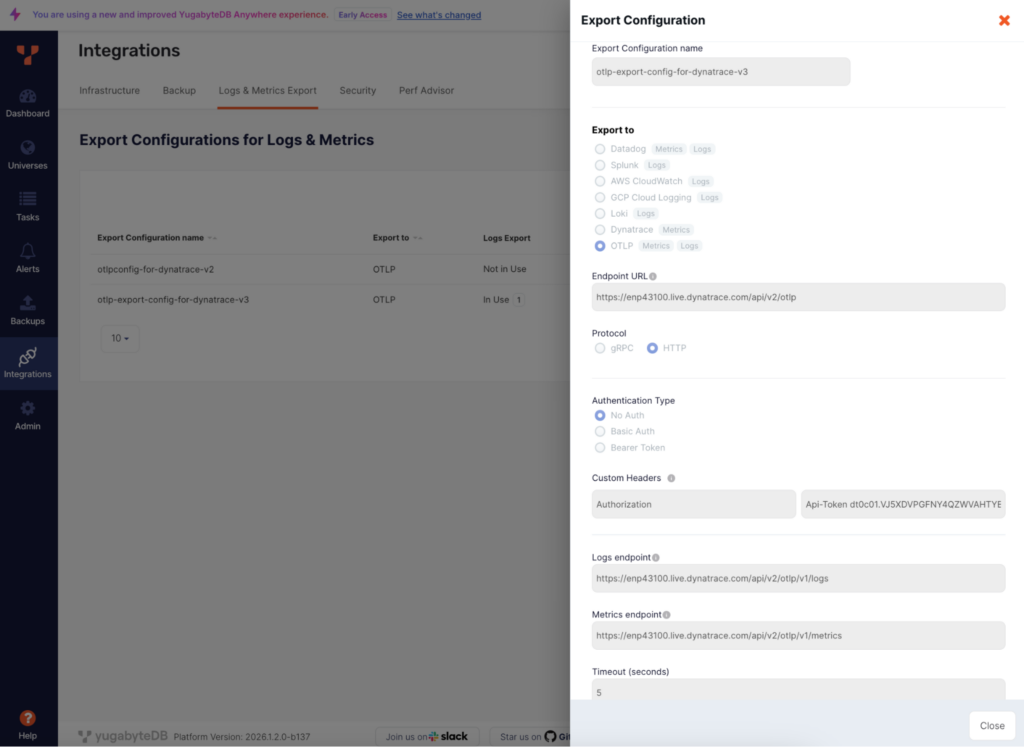
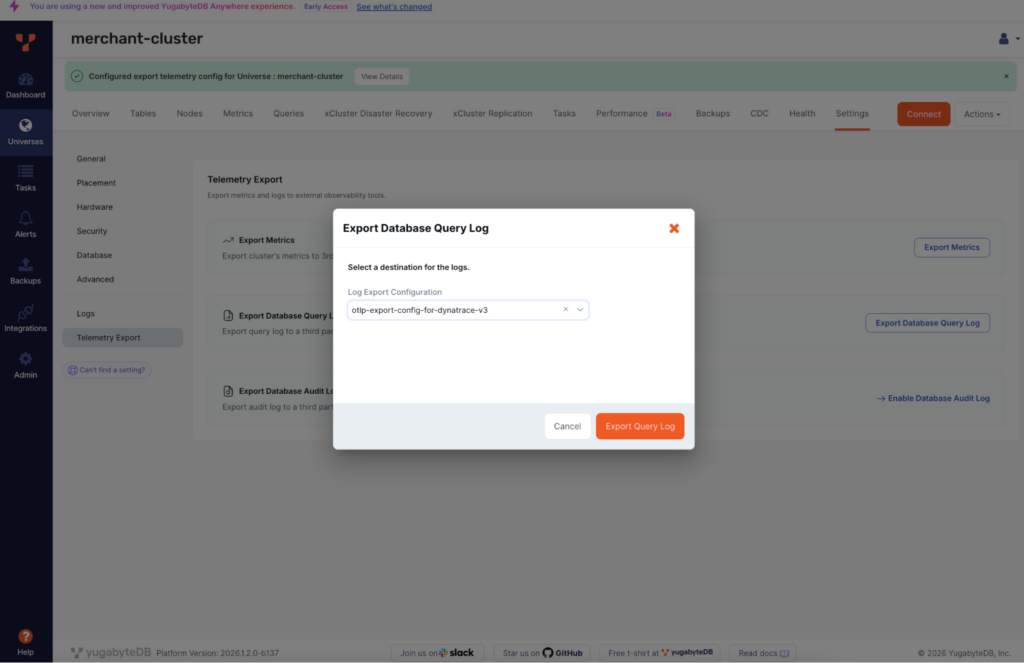
This successfully sets up the export configuration titled “otlp-export-config-for-dynatrace-v3” which will serve to route Database Query and Audit logs to Dynatrace in the following steps.
Step 3: Enabling Database Query Logging
You can now enable database logging using the YugabyteDB Anywhere control plane.
Navigate to YBA → Universes → {universename} → Settings → Logs
You will see two options:
- Enabling Database Query Log:
This enables explicit logging of performance-intensive slow queries based on a configured threshold. For troubleshooting and analysis, you can also enable logging of execution plans, connection attempts, and session terminations. - Enabling Database Audit Log:
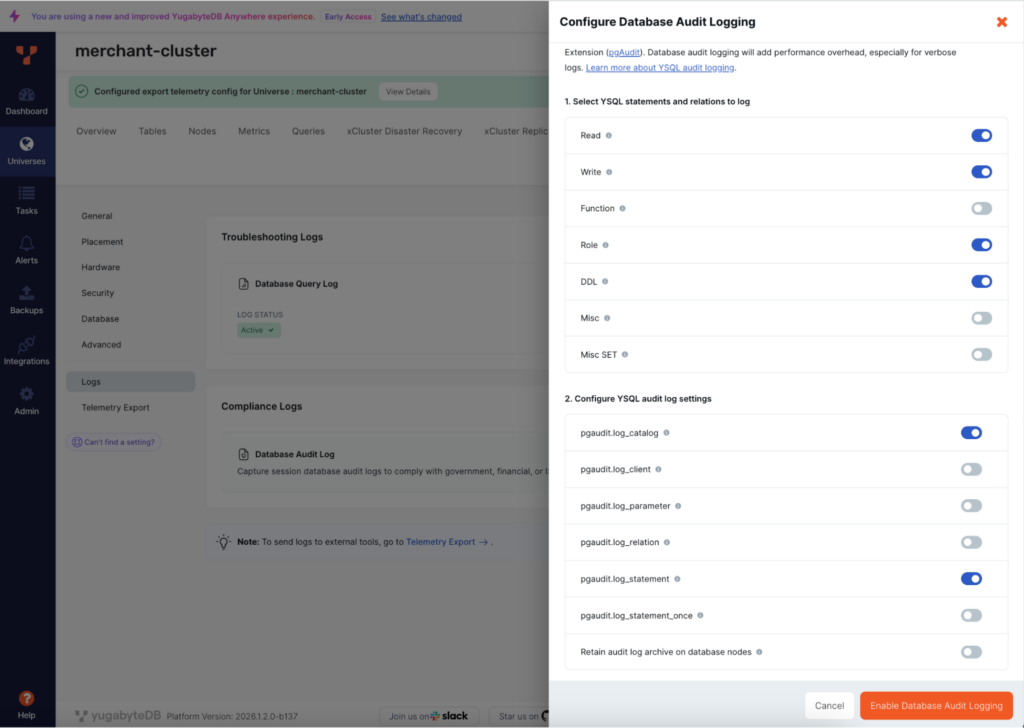
With Database Audit Logs, you can customize the YSQL statements, relations, and log settings logged using the PostgreSQL Audit Extension (pgAudit). Database audit logging will also add performance overhead, especially for verbose logs, so evaluate carefully and enable it for required prospects.
Note: The blog demonstration uses the new and most recent YBA UI, which is introduced in versions 2026.1.2 and higher.
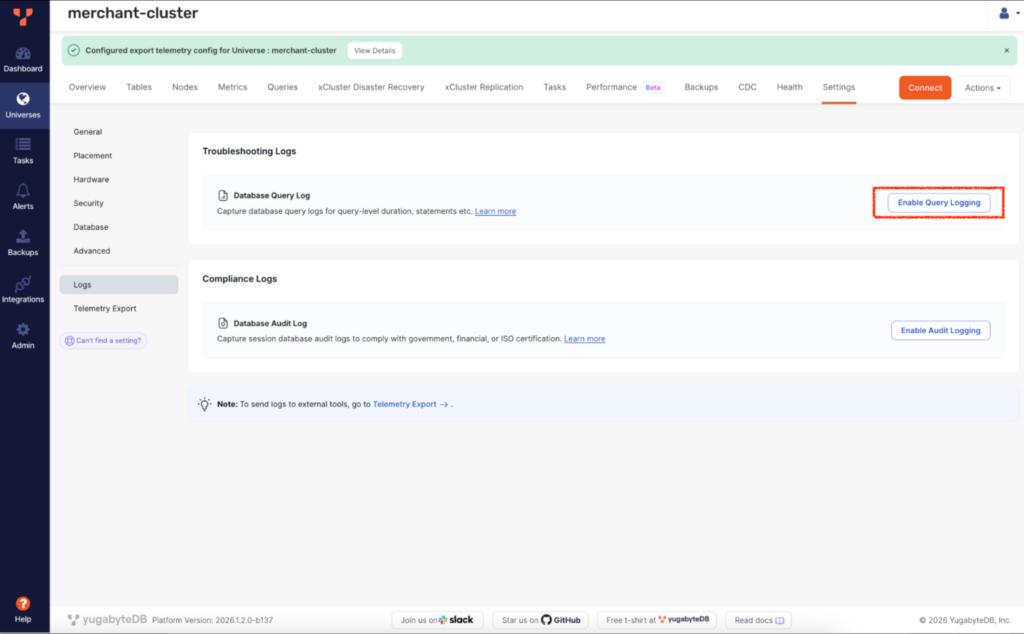
To align with our objective, we are configuring Database Query logging as follows:
- Capture all DDL operations.
- Log any query execution exceeding a 5000 ms threshold.
This also helps to keep logging minimal and send only the specific required logs to Dynatrace.
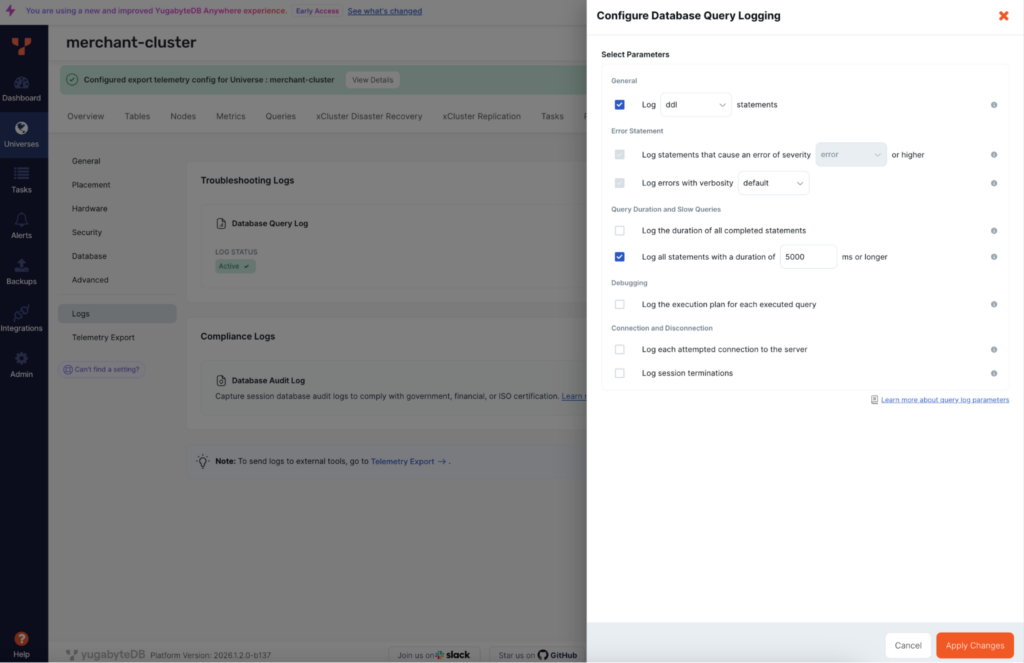
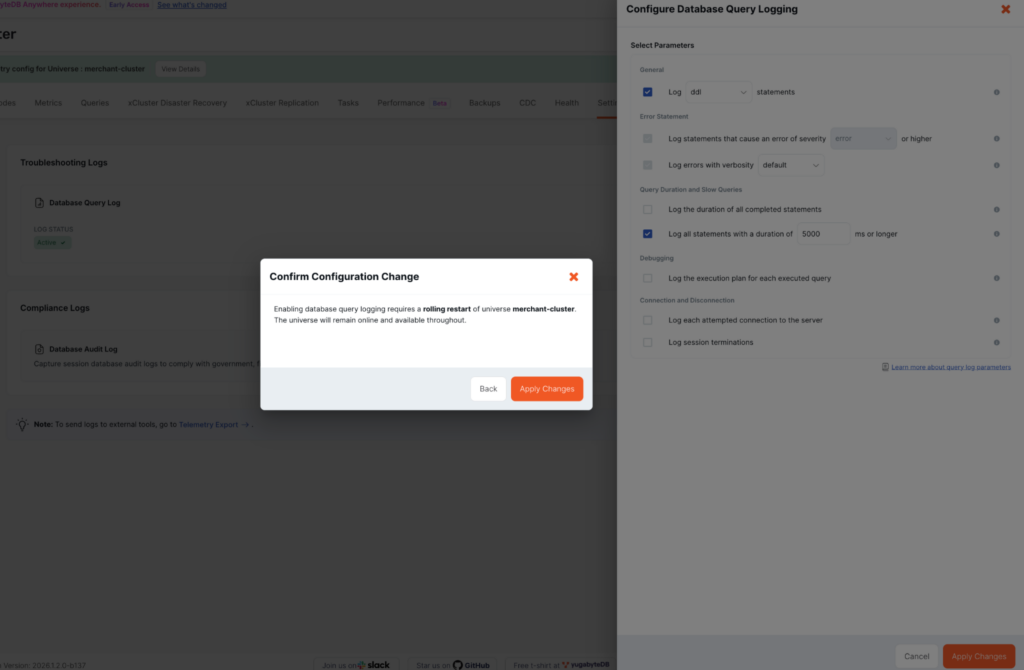
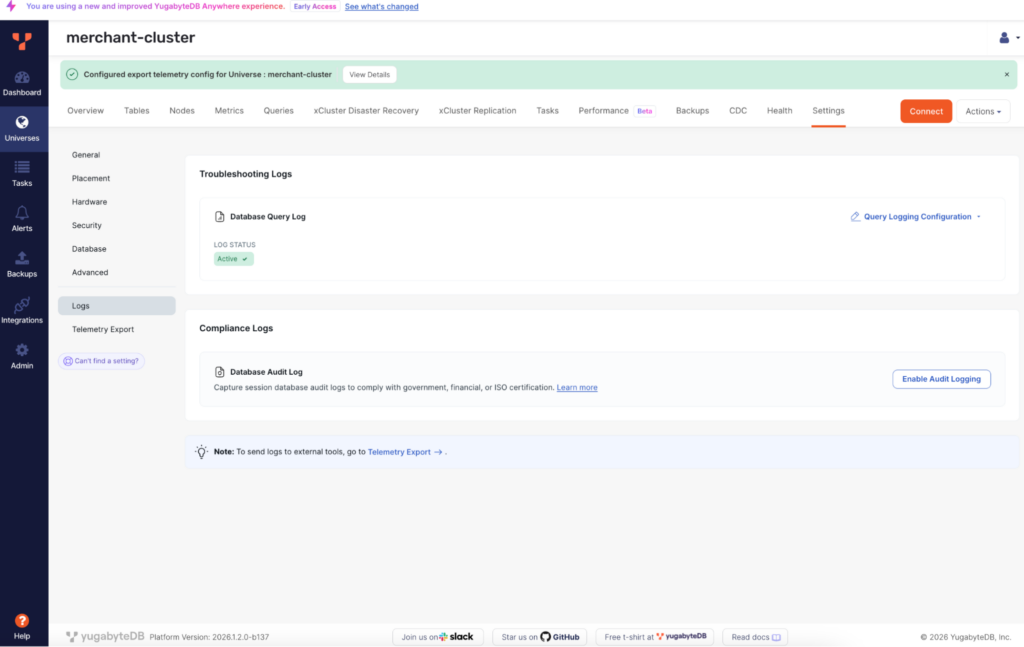
Consequently, the log_min_duration_statement setting will be applied across all nodes with a value of 5000 ms.
Although we are focusing on configuring database query logs here, the screenshot below illustrates additional audit logging options accessible under “Database Audit Logging.” You can activate these features to satisfy specific audit and compliance needs and export the resulting logs to Dynatrace or any other OTLP-compatible receivers listed earlier.
YugabyteDB Anywhere currently provisions the node-level OTEL collector as part of the database audit-log export workflow. Once the Database Query log is configured for the universe through YugabyteDB Anywhere, a new OTEL collector service will be up on all the nodes in your universe.
You can check the status of the OTEL collector service on each database node via the systemctl command as shown in the screenshot.

Refer to the corresponding OTEL logs and config file on each database node for more information:
/home/yugabyte/otel-collector/logs/otel-collector.logs
/home/yugabyte/otel-collector/config.yml
Important Note: Direct modifications to the OpenTelemetry (OTEL) collector configuration file (config.yml), such as updating regular expressions (regex) to include, exclude, or filter specific log entries, will be overwritten and reset to the default regex by YBA administrative tasks, such as modifying gflags or upgrading universes. If custom edits are required, establish a standard operating procedure (SOP) to reapply them following any such YBA operations.
Step 4: Configuring Telemetry Export Destination
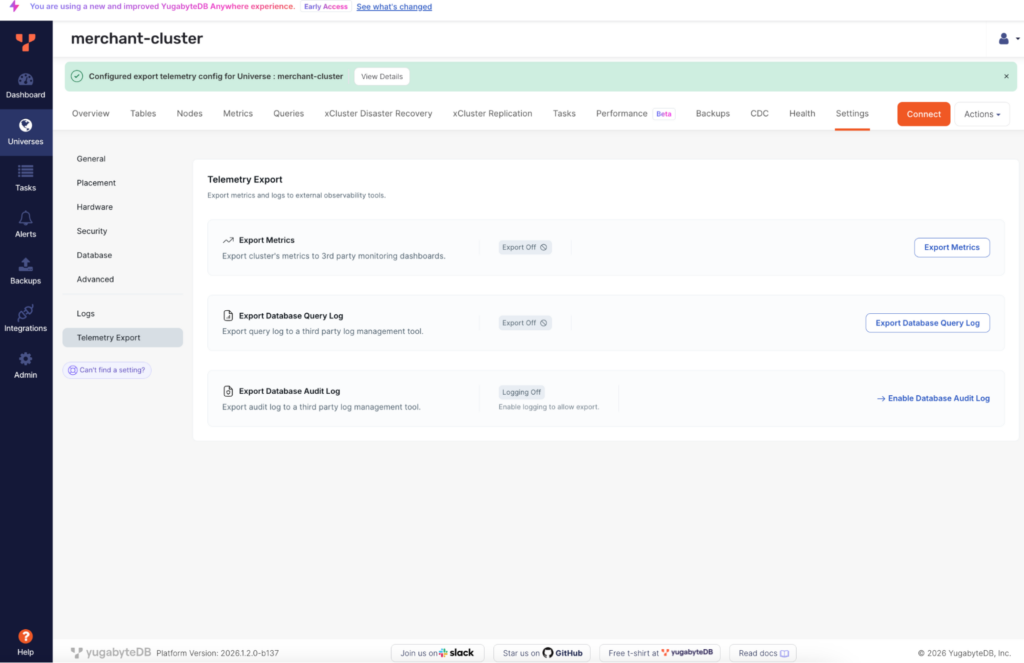
Enable the Export Database Query Log and select the export destination (Dynatrace) created in Step 2.
Step 5: Verifying the logs in Dynatrace
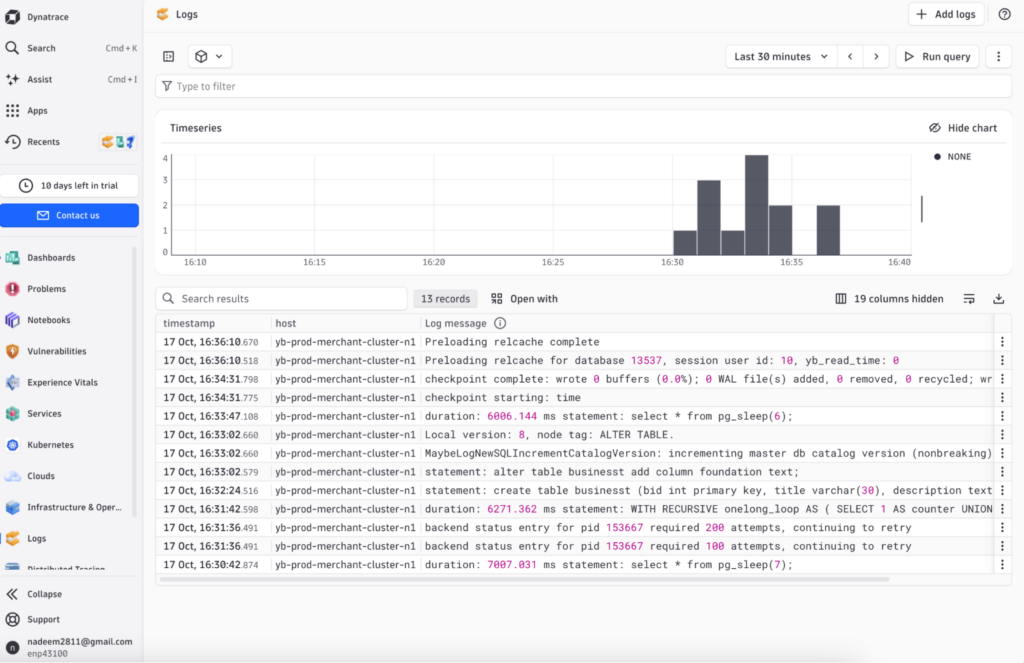
Verify logs in Dynatrace:
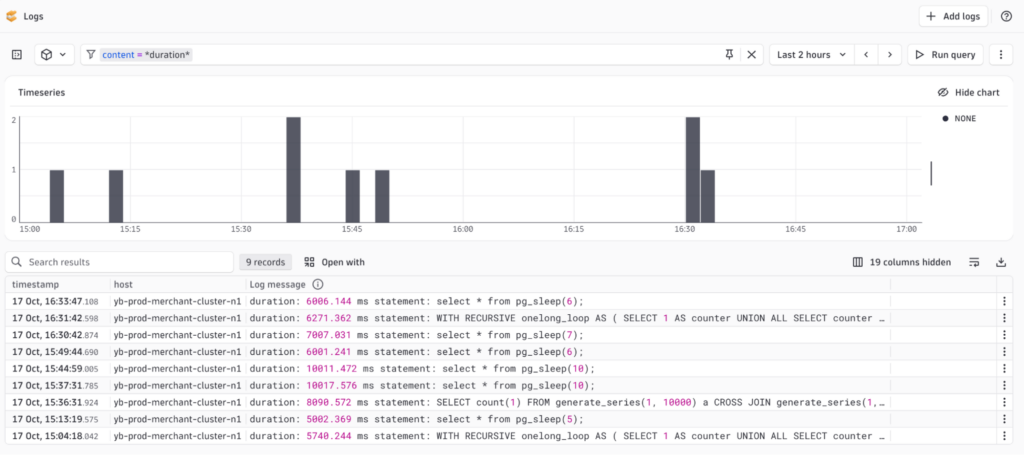
Apply a filter with a specific universe:
content = *duration* yugabyte.universe_uuid = 2720f9fe-3be8-4d92-a4c7-7198c053edcb
Step 6: Build Your Dashboard
Once the logs are flowing into Dynatrace, you can build a customized dashboard using the Dynatrace Query Language (DQL).
Navigate to Dashboards → New Dashboard → New Tiles (+) → DQL and use the following query:
Edit the DQL:
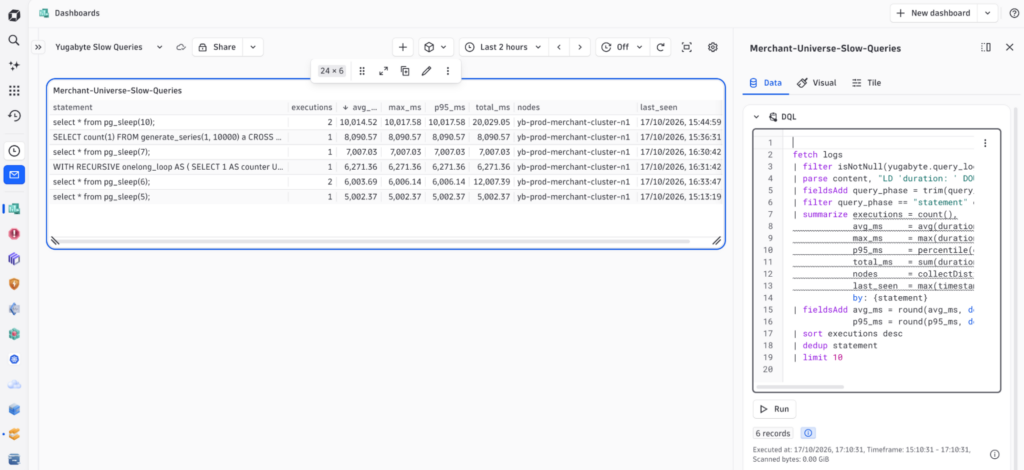
Sample DQL:
fetch logs
| filter isNotNull(yugabyte.query_log_type) and matchesPhrase(content, "duration:")
| parse content, "LD 'duration: ' DOUBLE:duration_ms ' ms' LD:query_phase ': ' DATA:statement"
| fieldsAdd query_phase = trim(query_phase), statement = trim(statement)
| filter query_phase == "statement" or startsWith(query_phase, "execute")
| summarize executions = count(),
            avg_ms     = avg(duration_ms),
            max_ms     = max(duration_ms),
            p95_ms     = percentile(duration_ms, 95),
            total_ms   = sum(duration_ms),
            nodes      = collectDistinct(yugabyte.node_name),
            last_seen  = max(timestamp),
            by: {statement}
| fieldsAdd avg_ms = round(avg_ms, decimals: 2),
            p95_ms = round(p95_ms, decimals: 2)
| sort executions desc
| dedup statement
| limit 10
The selected content above outlines how to query and monitor YugabyteDB logs in Dynatrace using the Dynatrace Query Language (DQL). You can customize it as per requirements.
Furthermore, you can set an alert in Dynatrace to notify you if the P95 latency for a query exceeds the specified threshold.
In this blog, we demonstrated how to build only one universe dashboard. You can build a dedicated dashboard for each of your universes and monitor them all through a single pane of glass.
Conclusion
By integrating YugabyteDB Anywhere with Dynatrace via the native OTLP exporter, organizations can achieve a unified, proactive observability strategy seamlessly.
This workflow enables centralized tracking of database audit logs, high-impact slow queries, and session-level logs. It also allows you to export only the desired logs and prevents all exhaustive, unwanted logs from being sent to OTLP receivers.
Want to know more about YugabyteDB Anywhere?

Watch this short video to learn how YugabyteDB Anywhere, a self-hosted control plane, can deploy, manage, and observe your distributed SQL universes in a private cloud, public cloud, or Kubernetes.