Simplify The Lift and Shift of PostgreSQL Apps With Familiar Read Committed Behavior
PostgreSQL users who want to easily lift and shift an application to a distributed PostgreSQL environment know that Read Committed Isolation with Wait-On-Conflict is critical to help minimize or eliminate any application re-architecture.
YugabyteDB 2.19.2 introduced a number of powerful new innovations, including full support for Read Committed Isolation with Wait-On-Conflict. This addition provides the same behavior as Read Committed for standard PostgreSQL, but in a distributed environment.
Why does this matter? Because you can now enjoy the familiarity of PostgreSQL with all the scale and resilience benefits that YugabyteDB brings to the table.
In this third blog post focused on new YugabyteDB features, we explore the addition of the Wait-On-Conflict function and share insights from the rigorous testing we did based on a specific customer request. This customer required not only Wait-On-Conflict, but also the ability to insert a timeout or delay so applications could finalize certain operations before database changes were fully committed.
Part 1 of New YugabyteDB 2.19 Features: Turbocharging PostgreSQL >>>
Part 2 of New YugabyteDB 2.19 Features: Built-In Connection Manager >>>
We also provide test result details that show YugabyteDB delivered smooth, predictable P99 latency across two different deployment topologies.
Introducing Wait-on-Conflict with Read Committed Isolation
Unlike many other distributed database options, YugabyteDB uniquely supports the three strictest transaction isolation levels of the SQL-92 standard.
Read Committed Isolation is the default isolation level in PostgreSQL. It is, therefore, critical to help users seamlessly evolve from PostgreSQL to a modern, distributed PostgreSQL database (like YugabyteDB).
Historically, YugabyteDB implemented row-level locks using a fail-on-conflict methodology for all isolation methods. This was useful when utilizing repeatable read and serializable isolation modes.
For applications wanting to utilize read committed, this fail-on-conflict methodology led to “unfairness” in the processing and resolution of row-level locks. To match PostgreSQL behavior and semantics, YugabyteDB 2.19.2 adds a “wait-on-conflict” methodology that has an internal queueing mechanism to maintain the order of the lock requests. This “wait-on-conflict” mode is applicable only in Read Committed Isolation.
This new feature is enabled by setting the YB-TServer gflag enable_wait_queues=true.
In this mode, transactions are not assigned priorities. If a conflict occurs when a transaction T1 tries to read, write, or lock a row in a conflicting mode with other concurrent transactions, T1 will wait until all conflicting transactions finish. Once all conflicting transactions have finished, T1 will do one of the following:
- Make progress if the conflicting transactions didn’t commit any permanent modifications that conflict with T1.
- Abort the transaction if a conflicting transaction committed a conflicting modification.
Extending and Testing the Flexibility of Wait-on-Conflict Mode
A YugabyteDB customer made a request that went beyond core support for Read Committed Isolation with Wait-On-Conflict. They had a scenario where they needed to provide a specified period of time for other application operations to happen between the SELECT FOR UPDATE request and the UPDATE/COMMIT.
In line with the flexibility and openness of YugabyteDB, we addressed their need and implemented a new wait_on_conflict_timeout setting.
To demonstrate how wait-on-conflict works and how the timeout provides a window for an application to complete other processes, we leveraged a new purpose-built test harness. The test harness ran tests that were executed with the wait_on_conflict_timeout set to 0, then adjusted to 1, 2, 5, and 10ms, with the default wait_on_conflict_timeout value set to 10ms.
The primary objective of our testing was to highlight YugabyteDB’s native support for Read Committed Isolation with Wait-On-Conflict and to provide examples of latency and throughput results when using varying wait_on_conflict_timeout values.
Test Setup For wait_on_conflict_timeout Setting
We used the testing environment outlined below to evaluate a multi-zone configuration. In addition, the relevant YugabyteDB Universe TSever Gflags that were configured are also listed.
Cloud environment:
Cloud: AWS
Region: US-East-1
Zones: us-east-1a, us-east-1b, us-east-1c
Database environment:
Node count: 3
Replication Factor (RF): 3
Instance type: c5.2xlarge (8 vCPU, 16GB, GP3 EBS Storage)
Version: YugabyteDB 2.19.2.0
Test harness and application server:
Node count: 1 (location: aws:us-east-1:us-east-1c)
Instance type: c5.2xlarge (8 vCPU, 16GB, GP3 EBS Storage)
Universe TServer Gflags:
yb_enable_read_committed_isolation = true
ysql_enable_packed_row = true
enable_wait_queues = true
enable_deadlock_detection = true
wait_queue_poll_interval_ms = 5
ysql_pg_conf_csv = yb_lock_pk_single_rpc=true
Setting the Test Up
So, now let’s look at the setup process for the wait_on_conflict_timeout testing.
Detailed below are the locations of the Stress Sample App v1.1.13 used for this testing, along with the procedures followed for the test. This information will be helpful if you wish to replicate the setup and conduct your own tests.
- Download and set up Stress Sample App 1.1.13 onto the test server.
- Make sure the right Java version is installed. We recommend getting the openjdk version 17 from Amazon.
Command To Run the Stress Test and Check Quantiles of Latency:
java -jar yb-stress-sample-apps-1.1.13.jar --workload SqlWaitQueues --drop_table_name daily_limit --nodes 10.36.3.248:5433,10.36.2.170:5433,10.36.1.142:5433 --transaction_type 2 --num_writes -1 --num_threads_write 15 --num_threads_read 1 --num_reads -1 --hikari_max_pool_size 30 --wait_on_conflict_all_customers true --wait_on_conflict_timeout 0


java -jar yb-stress-sample-apps-1.1.13.jar --workload SqlWaitQueues --drop_table_name daily_limit --nodes 10.36.3.248:5433,10.36.2.170:5433,10.36.1.142:5433 --transaction_type 2 --num_writes -1 --num_threads_write 15 --num_threads_read 1 --num_reads -1 --hikari_max_pool_size 30 --wait_on_conflict_all_customers true --wait_on_conflict_timeout 5
To determine the quantiles of latency for the statements, use the following SQL statement:
SELECT query, calls, total_time, min_time, max_time, mean_time, rows,yb_get_percentile(yb_latency_histogram, 99) as p99, yb_get_percentile(yb_latency_histogram, 95) as p95,
yb_get_percentile(yb_latency_histogram, 90) as p90 FROM pg_stat_statements WHERE query like '%for update%';
Here are some pointers to bear in mind if you want to run the tests and follow our process:
- Run the above JAR command from the test server
- Make sure to use the correct node name
- Set transaction_type 2 (transaction type to use (2 – RC, 4 – RR, 8 – SZ)
- num_threads_read/write is the number of threads read and writes
- hikari_max_pool_size is the Hikari connection pool max size
wait_on_conflict_timeoutis the timeout in ms that simulates other operations on the client side (default 10ms)- wait_on_conflict_all_customers specifies that we want to use all 3 rows during the test (default use only a single row)
High-Level Algorithm for Stress Sample App for Stress Sample App
begin;

select <column_name> from table where id=<random_id> and date=current_date for update;
sleep(configured_wait_on_conflict_timeout_value);
update table where id=<random_id> and date=current_date;

commit;
The Stress Sample App executes a transaction for each connection. In our testing, we utilized 15 write threads. All 15 connections will try to do the above. But, at any given time, only three connections will get the locks and other connections will wait as the above workload targets the three rows.
Deployment Architectures Tested
We ran the tests against two different architectural scenarios:
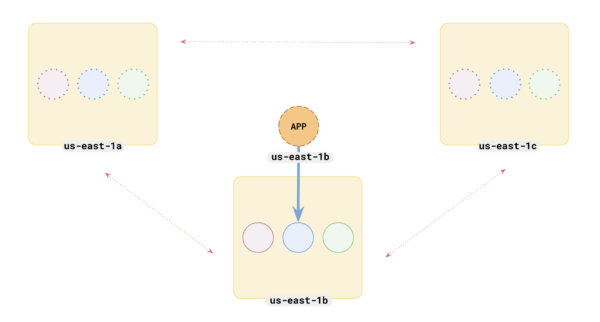
- Scenario One has a preferred zone set with all leaders in one zone
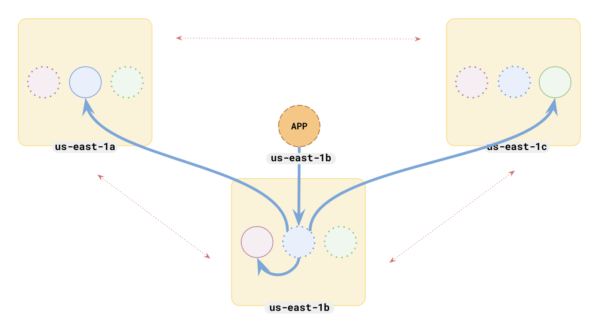
- Scenario Two has the default setting where leaders are spread across three zones
The preferred zone designation in our multi-zone, single-region configuration pins the tablet leaders to a single zone, which results in optimal performance by limiting some network hops.
In the first deployment architecture, we ran the test on a multi-zone cluster with the preferred region set. This meant the application server and tablet leaders were all located in the same zone.
Next, we ran the same tests on a second deployment architecture. In this scenario, we didn’t specify a preferred region so tablet leaders were spread across the three different zones in our multi-zone configuration.
Test Results for Two Deployment Scenarios
While your results will vary based on the application, hardware, and configuration selected, the results below can serve as a guide. Using these results, you can better estimate the tradeoffs made in terms of throughput and latency when imposing certain delays on the database through the wait_on_conflict_timeout setting.
Here are the results obtained with YugabyteDB 2.19.2 across the two deployment scenarios under different wait_on_conflict_timeout settings:
- In Scenario 1, the preferred region is specified, so the app server and tablet leaders are all in the same zone in a multi-zone setup.
- In Scenario 2, no preferred region is specified, so the tablet leaders are spread across three zones in a multi-zone setup.
We captured three key values for each test:
- Write throughput (measured in ops/sec)
- Write latency (measured in ms/op)
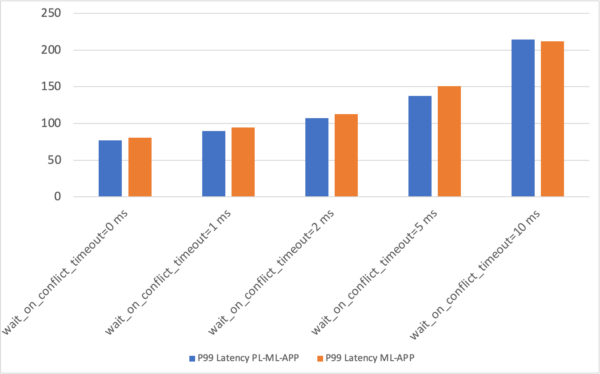
- P99 latency
| Scenarios | wait_on_conflict_timeout set to 0 | wait_on_conflict_timeout set to 1 | wait_on_conflict_timeout set to 2 | wait_on_conflict_timeout set to 5 | wait_on_conflict_timeout set to 10 |
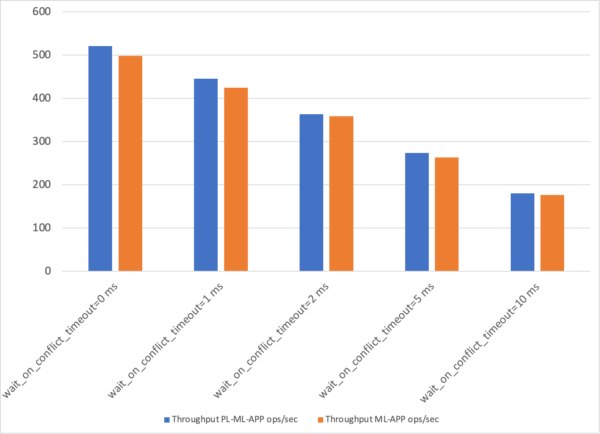
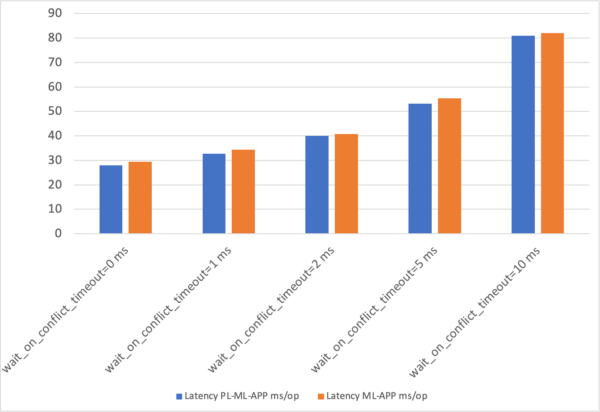
| Scenario 1: Leaders in the same zone | Write:~520.76 ops/secWith ~27.98 ms/opP99: 77.23 | Write:~445.26 ops/secWith ~32.77 ms/opP99: 89.99 | Write:~363.67 ops/secWith ~40.08 ms/opP99: 107.04 | Write:~273.97 ops/secWith ~53.23 ms/opP99: 137.85 | Write:~180.04 ops/secWith ~80.98 ms/opP99: 214.46 |
| Scenario 2: Leaders spread across three zones | Write:~498.4 ops/secWith ~29.38 ms/opP99: 80.85 | Write:~424.71 ops/secWith ~34.32 ms/opP99: 94.36 | Write:~358.66 ops/secWith ~40.68 ms/opP99: 113.02 | Write:~263.33 ops/secWith ~55.34 ms/opP99: 150.81 | Write:~176.47 ops/secWith ~82.04 ms/opP99: 211.97 |
A Look at the Graphical Representation of the Data
The charts below provide a clearer view of the results, displaying each of the three metrics captured across five timeout settings for both deployment scenarios.
The following abbreviations are used in the charts:
- PL = preferred leader
- ML = master (leader)
- APP = application server
Write Throughput in Ops/Sec
Write Latency in MS/Op
P99 Latency
Summary of Results
As the test results show, YugabyteDB delivers smooth, predictable P99 latency and excellent throughput performance for Read Committed Isolation with Wait-On-Conflict.
With this feature included in our latest release, YugabyteDB now provides the same semantics as PostgreSQL. This simplifies the process of “lifting-and-shifting” applications that need built-in resilience, on-demand scale, and features that help simplify operations to YugabyteDB.
Learn More
- For more information about the isolation modes available in YugabyteDB, read the transaction isolation levels in YugabyteDB Docs.
- You can also check out the first in our series of YugabyteDB 2.19 feature blogs: Built-in Connection Manager Turns Key PostgreSQL Weakness into a Strength.


