Exploring the New YugabyteDB Cost Based Optimizer
YugabyteDB brings cloud-native scalability and resilience to PostgreSQL. To achieve this, we combine the existing PostgreSQL query layer with a distributed storage layer that replicates and distributes data across multiple nodes.
We aim to ensure that developers migrating PostgreSQL apps to YugabyteDB can enjoy all the advantages of distributed systems without sacrificing existing PostgreSQL features or performance.
A key challenge in a distributed SQL database is achieving high throughput and consistency for both write and read operations. We’ve developed several optimizations to achieve high write throughput, for example, Write Buffering to reduce RAFT Consensus Latency. In this blog, we focus on the Cost Based Optimizer, an essential piece of the puzzle to achieve high throughput for read operations.
This project is part of our wider effort to achieve PostgreSQL performance parity. Discover more about this initiative in our recent launch blog.
Why We Decided to Create a New Cost Based Optimizer for YugabyteDB
SQL is a declarative language. This means a user describes how the result of a query should look, not how it should be computed. It is the job of the query optimizer to identify the optimal execution plan for the query.
The optimizer must decide which indexes to use, which join algorithms to use, and which join order to use to achieve the best performance. To do this, the query planner emulates different execution plans and estimates the cost to execute each plan. It chooses the plan with the lowest cost. This is known as Cost Based Optimization (CBO).
By reusing the query layer from PostgreSQL, we were able to utilize much of the robust and battle-tested code in the query optimizer.
However, we cannot simply reuse the CBO from PostgreSQL as the performance characteristics of YugabyteDB differ from PostgreSQL. For example, a Nested Loop is more expensive in a multi-node YugabyteDB cluster compared to a single-server PostgreSQL instance due to additional network round trips.
In the early days of YugabyteDB, we developed a heuristics based CBO. Although simple, it proved to be effective with most customer use cases. In cases when the heuristics based CBO failed to find the best plan, our users could utilize the pg_hint_plan extension to force the optimizer to choose a more efficient plan.
We then focused our efforts on developing novel techniques to maximize the throughput of our distributed storage backend. This included Batched Nested Loop Joins, Filter Pushdown, etc. (more on these later). However, these optimizations were difficult to model in the heuristic CBO, which meant the CBO would sometimes miss opportunities to utilize the optimizations and pick suboptimal plans.
Our customers also started deploying YugabyteDB clusters with diverse and complex topologies. Cluster topology can greatly impact the performance of an execution plan. Again, it proved difficult to model aspects such as network throughput and features such as Read Replicas and Geo-partitioning on the heuristic CBO, and customers noticed that sometimes the best plans were not being chosen.
It was clear that we needed to go back to the drawing board and design and develop a new CBO tailor-made for YugabyteDB. This turned out to be an exciting and challenging project requiring close collaboration among various YugabyteDB teams.
The new CBO helps us achieve remarkable performance improvements (as you will see later in this blog). Our CBO brings the following benefits:
- It accurately models the complexities of our distributed storage backend such as LSM Index lookup, data replication and distribution, network throughput, etc.
- It models optimizations such as Batched Nested Loop Joins and Filter Pushdowns.
- It is aware of the cluster topology and can pick plans that best utilize the available resources.
- It is designed to be extensible to model future improvements.
We developed a special framework called TAQO (Testing the Accuracy of Query Optimizer) for validation testing of the CBO. This is detailed later in this blog. We used this tool to test the CBO against multiple benchmarks. The results show that the efficacy rate of the new cost model is significantly better than the heuristic cost models, and closely matches that of PostgreSQL. This leads to much-improved performance across all workloads.
How Does the PostgreSQL Cost Based Optimizer Work?
As mentioned, it is the job of the query planner to find the most optimal execution plan for the query.
Consider the following query example. We want to find all available books from the Science Fiction genre, along with the names of the author and publisher of each book.
SELECT b.book_title, a.author_name, p.publisher_name
FROM authors a
INNER JOIN books b ON a.author_id = b.author_id
INNER JOIN publishers p ON b.publisher_id = p.publisher_id
WHERE b.genre = 'Science Fiction';
One possible plan to execute this query is visualized below as a tree. Each node represents an operation such as scan or join.
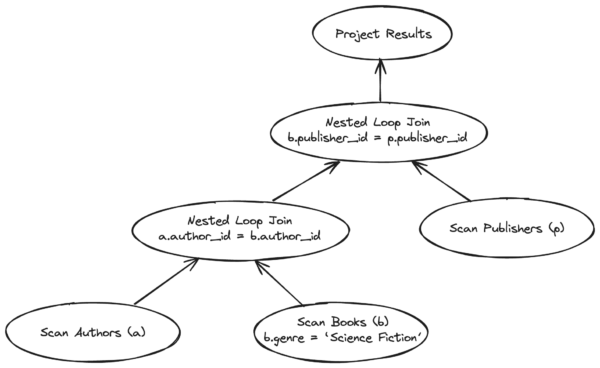
We can also imagine other execution plans with different scan types (sequential or index scans) for the base tables, different join orders, and join algorithms. The search space for possible execution plans for a query grows exponentially with the number of join tables and indexes on those tables.
The query planner in PostgreSQL comprises four key components, illustrated in the following diagram.
- Execution Plan Search Algorithm
- Statistics
- Selectivity Estimation
- Cost Model
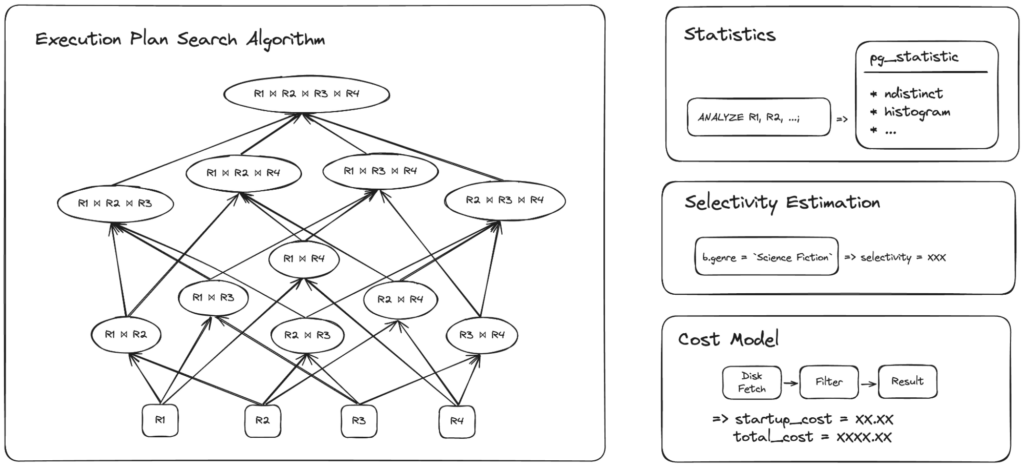
To optimize the search for the best plan, PostgreSQL uses a dynamic programming-based algorithm (illustrated on the left of the image above). Instead of enumerating and evaluating the cost of each possible execution plan, it breaks the problem down and finds the most optimal sub-plans for each piece of the query. The sub-plans are then combined to find the best overall plan.
The other three components are used to compute the cost of each sub-plan. PostgreSQL collects statistics such as the number of distinct values and a histogram of data distribution for each column in the tables. This is generally triggered automatically on PostgreSQL as part of VACUUM, but it can also be triggered manually using the ANALYZE command.
The statistics are used in selectivity estimation, where the query planner tries to predict the number of rows that each operation in the execution plan will produce by analyzing the filters and join predicates.
The selectivity estimate is fed to the cost model to predict the cost of executing the operation to produce the result.
What Needs to Change in YugabyteDB?
The query planner in PostgreSQL has been fine-tuned and battle-tested over decades. Fortunately, we can reuse much of this robust code in YugabyteDB. The search algorithm and selectivity estimation do not need to change.
We had to implement a new mechanism to sample the data in DocDB to collect statistics and we reused the code from PostgreSQL to compute the statistics. Note: this is currently not triggered automatically on YugabyteDB and must be triggered manually using the ANALYZE command. Work is underway to further optimize the performance of ANALYZE and to trigger it automatically depending on the amount of write activity on the tables.
We also had to develop a new cost model to accurately model the DocDB storage engine and estimate the cost of the execution plans, more on that in the coming section.
How Does the New Cost Model Work?
To explain how the new cost model works, we have detailed how we have modeled some of the key aspects of YugabyteDB. Let us consider the case for index scan, because the cost model for sequential scan is relatively simple and reuses parts of the index scan cost model.
DocDB Storage
YugabyteDB uses a distributed storage layer called DocDB. It is a key-value store based on the log-structured merge-tree (LSM) index. You can find more details in the links above, but below is a simplified explanation of how DocDB works.
Each tuple in YugabyteDB is stored as a key-value pair where the key is an encoded form of the primary index key and the value contains the content of other columns in the table in a serialized format. Writes to a table are first buffered in memtables which can be thought of as an in-memory sorted data structure. After a memtable reaches a threshold size, it is made immutable and flushed to disk as an SST (Sorted String Tree) file.
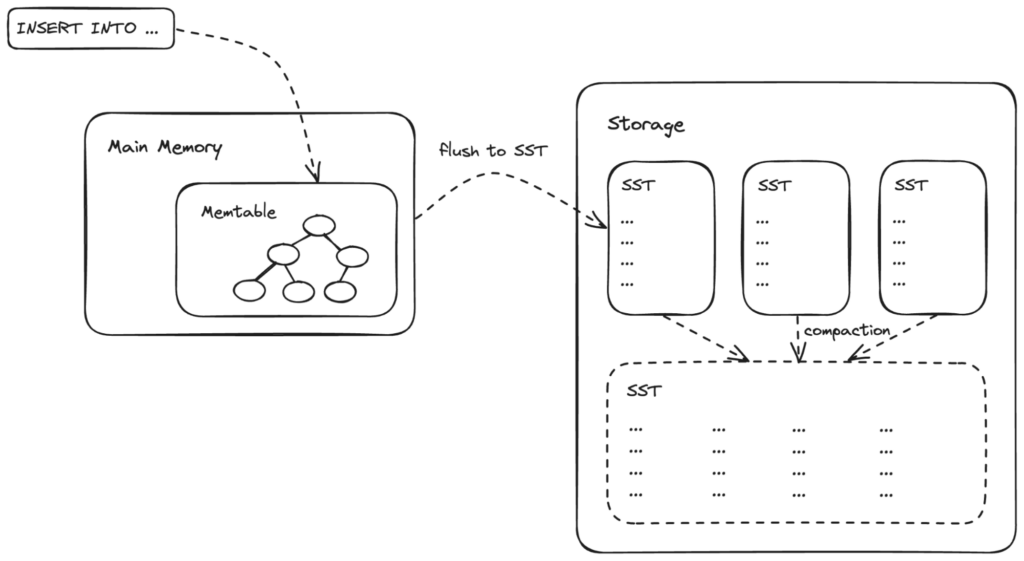
Since the SST files are immutable, updates to certain columns in a tuple are stored as separate key-value pairs, as depicted below. To fetch the latest version of a tuple we must search for the key in all SST files and merge them to construct the tuple. Similarly, deletions are marked with tomb-stones.
Over time multiple SST files are compacted. Compaction and optimizations such as bloom filters help reduce the number of SST files that need to be looked up for a particular key.
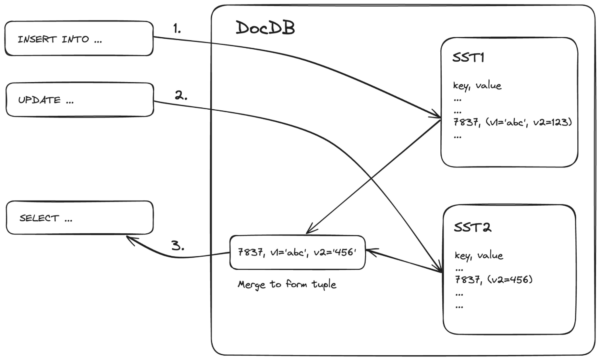
To model this complexity, we collect statistics including the average number of key-value pairs per tuple and number of SST files for each table. We use these to estimate the cost of fetching a tuple from DocDB.
Note: We currently use heuristic values for average number of key-value pairs per tuple and number of SST files for each table in the cost model. There is ongoing work to collect these statistics during ANALYZE. Heuristic values work reasonably well in most scenarios but may cause problems in tables that have too many partial updates or too many SST files.
LSM Index Lookup
The operation to lookup a DocDB key is called a seek. The operation to fetch the following key is called a next. The operation to fetch the preceding key is called previous.
A seek is significantly more expensive than a next and previous. Due to the way the data is compressed, a previous operation is slightly more expensive than a next, which causes backward index scans to be less efficient compared to forward scans.
The cost of each seek, next, and previous operation is computed by taking into consideration the number of SST files and average number of key-value pairs per tuple.
To predict the number of seek, next, and previous operations that will be performed during an index scan, we model the workings of the LSM index.
The LSM index can be used to lookup individual keys and also for scanning a range of values between keys. It can also be used to optimize lookup of partial index keys. DISTINCT operation can also be pushed down to DocDB and optimized using the index.
By analyzing the query, we identify how the index will be used. From the column statistics we try to predict the number of seek, next, and previous operations that will be performed. We get the total cost of index lookup by multiplying this with estimated costs for the operations.
Consider the following example: We have a table with 1 million rows and a primary index key with 4 columns.
yugabyte=# CREATE TABLE t_1m_4keys(k1 INT, k2 INT, k3 INT, k4 INT,
    PRIMARY KEY (k1 ASC, k2 ASC, k3 ASC, k4 ASC));
yugabyte=# INSERT INTO t_1m_4keys (select s1, s2, s3, s4 from
  generate_series(1, 10) s1,
          		  generate_series(1, 20) s2,
  generate_series(1, 50) s3,
        generate_series(1, 100) s4);
yugabyte=# ANALYZE t_1m_4keys;
With the new cost model, we run the query using EXPLAIN (ANALYZE, DEBUG, DIST).
The output has been snipped here. You can see the Estimated Seeks and Estimated Nexts produced from the cost model. This estimate nearly matches the actual number of seeks (rocksdb_number_db_seek) and nexts (rocksdb_number_db_next) performed in DocDB.
EXPLAIN (ANALYZE, DEBUG, DIST) SELECT * FROM t_1m_4keys WHERE k1 > 8 AND k4 > 50;

                                                                   QUERY PLAN
------------------------------------------------------------------------------------------------------------------------------------------------
 Index Scan using t_1m_4keys_pkey on t_1m_4keys  (cost=180.00..266325.19 rows=100543 width=16) (actual time=1.731..139.903 rows=100000 loops=1)
   Index Cond: ((k1 > 8) AND (k4 > 50))
   Storage Table Read Requests: 98
   Storage Table Read Execution Time: 114.711 ms
   ...
   Metric rocksdb_number_db_seek: 2098.000
   Metric rocksdb_number_db_next: 104097.000
   ...
   Estimated Seeks: 2099
   Estimated Nexts: 104641
   ...
 Planning Time: 5.623 ms
 Execution Time: 152.013 ms
 ...
Primary vs Secondary Index Scan
The image below illustrates how data is stored in PostgreSQL vs YugabyteDB.
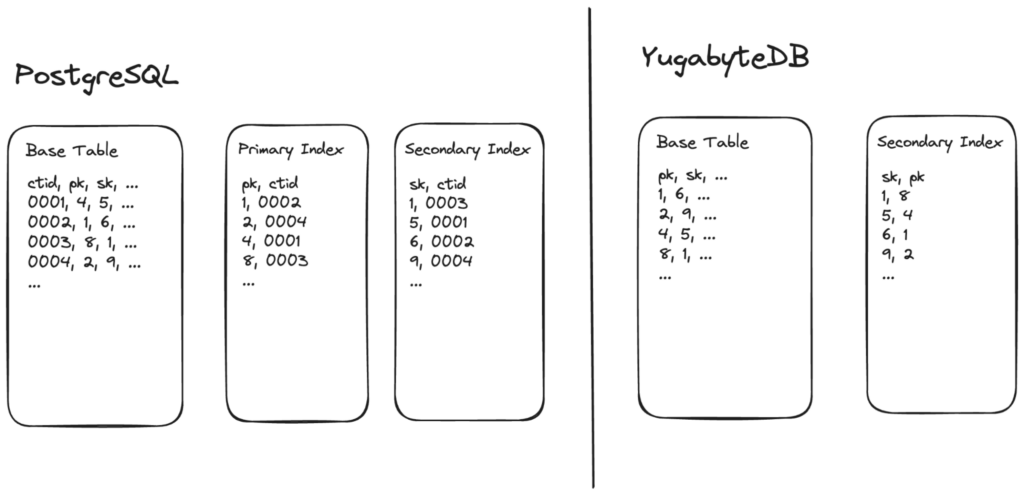
On PostgreSQL, data is written to the base table in the order of insertion. Each row gets a unique and monotonically increasing ctid. The primary and secondary indexes are stored separately. These are b-trees sorted on the index key and point to the ctid of the corresponding tuple in the base table. To search for a tuple using the index, we must first look up the key in the index to get the ctid. We would then look up the ctid in the base table.
In the case of YugabyteDB, each SST of the base table is sorted in the order of the primary key. In other words, the primary key is part of the base table. This makes primary index lookup cheaper compared to secondary index lookup in YugabyteDB.
This distinction has been modeled in the new cost model.
Storage Filter Pushdown
Earlier, the PostgreSQL query layer would request DocDB for all rows from a table, and any filters on the table would be executed in the query layer. This means a lot of data would need to be transferred over the network from DocDB to the query layer, only to be discarded due to the filters.
To optimize this, the feature to push down filters to DocDB was implemented. This leads to a reduction in the amount of data that needs to be transferred over the network.
To model this optimization, we identify the filters that will be pushed down to DocDB. We compute the selectivity of these filters and use that information to estimate the cost of executing these filters on the DocDB side and the cost of transferring the result over the network. This is demonstrated in the next section.
Network Cost Modeling
Network throughput is often a performance bottleneck in distributed workloads and it is important to model it correctly in the cost model.
We estimate the size and number of tuples that will be transferred from DocDB to the PostgreSQL query layer.
This result is transferred in pages and the size of each page is determined by yb_fetch_row_limit and yb_fetch_size_limit GUCs. We compute the number of pages that will be transferred. Each page would require a network round trip for request and response, which is affected by the latency of the network connection. The time spent transferring the data will depend on the network bandwidth.
We model this by applying heuristic costs for the latency and data transfer. These values have been tuned using our validation framework (TAQO) with multiple targeted tests to isolate these effects.
Let’s look at another example, which highlights the efficiency of the aspects mentioned above.
First, we create a table with 1 million rows.
yugabyte=# CREATE TABLE t_1m (k INT, v INT, PRIMARY KEY (k ASC));
CREATE TABLE
yugabyte=# CREATE INDEX t_1mindex ON t_1m (v ASC);
CREATE INDEX
yugabyte=# INSERT INTO t_1m (SELECT s, 1000000 - s FROM generate_series(1, 1000000) s);
INSERT 0 1000000
Let’s see the plan we would get without the new CBO on the following queries, with filters on the primary key and secondary key.
-- Current Default behavior
-- Filter on primary key, primary index scan is picked.
yugabyte=# EXPLAIN ANALYZE SELECT * FROM t_1M WHERE k > 700000;
                                                      QUERY PLAN
-----------------------------------------------------------------------------------------------------------------------
 Index Scan using t_1m_pkey on t_1m  (cost=0.00..4.11 rows=1 width=8) (actual time=1.343..273.379 rows=300000 loops=1)
   Index Cond: (k > 700000)
 Planning Time: 0.058 ms
 Execution Time: 294.762 ms
 Peak Memory Usage: 24 kB
(5 rows)

-- Filter on secondary key, secondary index scan is picked.
yugabyte=# EXPLAIN ANALYZE SELECT * FROM t_1M WHERE v > 700000;
                                                       QUERY PLAN
-------------------------------------------------------------------------------------------------------------------------
 Index Scan using t_1m_index on t_1m  (cost=0.00..5.22 rows=10 width=8) (actual time=4.442..916.520 rows=299999 loops=1)
   Index Cond: (v > 700000)
 Planning Time: 0.058 ms
 Execution Time: 939.228 ms
 Peak Memory Usage: 24 kB
(5 rows)
For the first query with a filter on the primary key, the optimizer picked a plan with a primary index scan. Similarly, for the second query, with a filter on the secondary key, the plan with a secondary index scan was picked.
Now, let’s run ANALYZE to collect statistics for the table and enable the new cost model, and see if the CBO picks a different plan.
-- ANALYZE table and enable new cost model
yugabyte=# ANALYZE t_1m;
ANALYZE
yugabyte=# SET yb_enable_base_scans_cost_model = ON;
SET

-- Filter on primary key; primary index scan is used.
yugabyte=# EXPLAIN ANALYZE SELECT * FROM t_1M WHERE k > 700000;
                                                            QUERY PLAN
-----------------------------------------------------------------------------------------------------------------------------------
 Index Scan using t_1m_pkey on t_1m  (cost=180.00..503065.20 rows=299437 width=8) (actual time=1.421..274.140 rows=300000 loops=1)
   Index Cond: (k > 700000)
 Planning Time: 0.071 ms
 Execution Time: 295.646 ms
 Peak Memory Usage: 24 kB
(5 rows)

-- Filter on secodary key; Seq scan is preferred, which is faster.
yugabyte=# EXPLAIN ANALYZE SELECT * FROM t_1M WHERE v > 700000;
                                                   QUERY PLAN
-----------------------------------------------------------------------------------------------------------------
 Seq Scan on t_1m  (cost=180.00..887752.37 rows=297543 width=8) (actual time=1.488..571.744 rows=299999 loops=1)
   Storage Filter: (v > 700000)
 Planning Time: 0.063 ms
 Execution Time: 594.098 ms
 Peak Memory Usage: 24 kB
(5 rows)

-- Force use of secondary index, notice the higher cost.
yugabyte=# /*+ IndexScan(t_1m t_1m_index) */ EXPLAIN ANALYZE SELECT * FROM t_1M WHERE v > 700000;
                                                             QUERY PLAN
-------------------------------------------------------------------------------------------------------------------------------------
 Index Scan using t_1m_index on t_1m  (cost=188.44..3012234.39 rows=297543 width=8) (actual time=4.408..884.885 rows=299999 loops=1)
   Index Cond: (v > 700000)
 Planning Time: 0.111 ms
 Execution Time: 907.062 ms
 Peak Memory Usage: 24 kB
(5 rows)
As you can see, the new cost model picks Sequential Scan for the query with the filter on the secondary index key and it is indeed faster than using the secondary index scan.
The filter on the column v is pushed down to DocDB. This means that only the rows that match the filter will be transferred from DocDB to the PG query layer. The new cost model was able to identify and account for this.
When we force the planner to use the secondary index, we see that the new cost model assigns a higher cost to it than the sequential scan.
Let’s try a query with an IN filter instead of an inequality filter, and with much lower selectivity.
-- Filter on primary key, primary index is used.
yugabyte=# EXPLAIN ANALYZE SELECT * FROM t_1m WHERE k IN (123456, 234567, 345678, 456789, 567890, 678901, 789012, 890123, 901234);
                                                     QUERY PLAN
--------------------------------------------------------------------------------------------------------------------
 Index Scan using t_1m_pkey on t_1m  (cost=180.00..649.35 rows=9 width=8) (actual time=1.041..1.045 rows=9 loops=1)
   Index Cond: (k = ANY ('{123456,234567,345678,456789,567890,678901,789012,890123,901234}'::integer[]))
 Planning Time: 0.086 ms
 Execution Time: 1.084 ms
 Peak Memory Usage: 24 kB
(5 rows)

-- Filter on secondary key, secondary index is used.
yugabyte=# EXPLAIN ANALYZE SELECT * FROM t_1m WHERE v IN (123456, 234567, 345678, 456789, 567890, 678901, 789012, 890123, 901234);
                                                     QUERY PLAN
---------------------------------------------------------------------------------------------------------------------
 Index Scan using t_1m_index on t_1m  (cost=188.44..737.79 rows=9 width=8) (actual time=1.836..1.841 rows=9 loops=1)
   Index Cond: (v = ANY ('{123456,234567,345678,456789,567890,678901,789012,890123,901234}'::integer[]))
 Planning Time: 0.077 ms
 Execution Time: 1.880 ms
 Peak Memory Usage: 24 kB
(5 rows)
With a filter like this, the balance shifts in favor of a secondary index scan, as fewer lookups are needed in the base table in this case.
Testing the Accuracy of the Query Optimizer
The Cost Based Optimizer is a critical and impactful component in a database. So, it is crucial to perform thorough validation testing of the CBO.
However, testing the CBO is very challenging. We can write regression tests to verify that we get the expected best plan for a simple query, but as query complexity increases it becomes harder for the test developer to identify the best execution plan for the query, or even to verify if the plan picked is indeed the best plan. Additionally, as new optimizations are implemented the best plan for a query may change. In this case, our tests must fail to highlight the need to enhance the cost models to reflect the new optimizations.
To achieve these goals, we spent time developing a special framework to test the CBO. This framework called “Testing the Accuracy of Query Optimizer,” TAQO for short, is motivated by this paper.
To verify that the default plan generated for a query by the CBO is indeed the best plan, the TAQO framework enumerates various ways in which the query can be executed. It then runs the queries by forcing these execution plans using the pg_hint_plan extension. Various optimization techniques built into the framework help reduce the test runtime.
The tool generates comprehensive reports for each benchmark, which have guided our engineering efforts. It also:
- Reports the efficacy of the CBO, which is the percentage of queries for which we found the best plan.
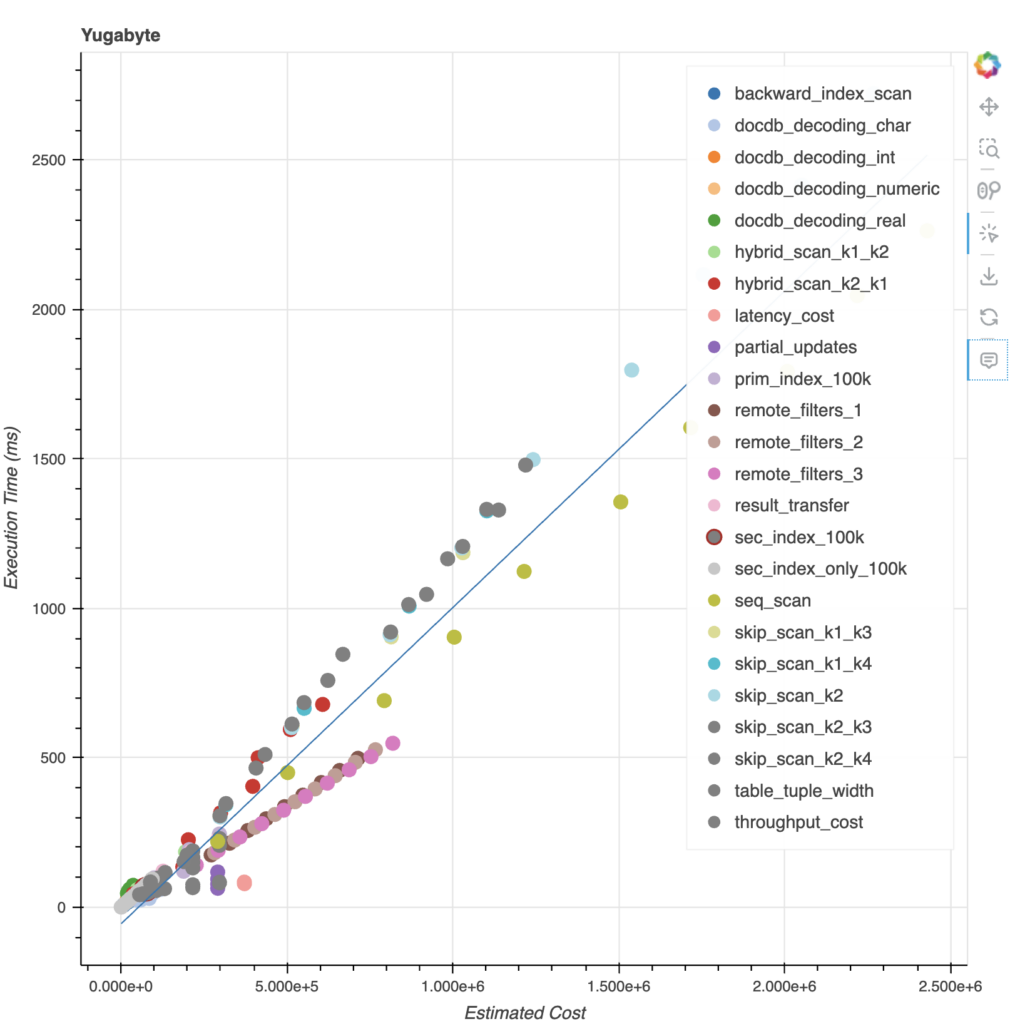
- Shows an interactive graph where we plot the estimated cost against actual execution time for each query in the benchmark and visualize the accuracy of the cost.
Below is the graph from an internal benchmark used for tuning the heuristic cost parameters in the cost model. The individual points represent the cost and execution time for each query, and the blue line represents the linear regression. This chart shows that the estimated costs closely correlate with the execution time.
You can learn more about the TAQO framework in this recent YFTT talk.
CBO Test Results
Benchmarks
We developed many internal benchmarks to put the CBO through its paces.
In most of these benchmarks, we met the efficacy rate of PostgreSQL. We also saw significant performance improvements. However, it is important to test CBO with realistic data which has complex data distribution, column correlations, and realistic queries.
We have tested the CBO on the well-known TPC-H benchmark and the Join Order Benchmark which is derived from the IMDB workload and used in this research paper.
As noted in the paper, it is relatively easier for a CBO to predict a good plan for queries in the TPC-H benchmark as selectivity estimation performs relatively well when the TPC-H data has uniform distribution and correlations.
The Join Order Benchmark has real-life data with complex correlations and data patterns. The PostgreSQL selectivity estimation is known to underestimate selectivity in such cases, which often leads to poor plan choices. This distinction can be noticed from the results presented below.
Efficacy Rate
The table below shows the efficacy rates achieved in colocated (single primary database instance) and distributed workloads with the new cost model compared to the default configuration on YugabyteDB 2024.1 and PostgreSQL 15.
| Benchmark | New Cost Model | YB 2024.1 Default | PostgreSQL 15 |
|---|---|---|---|
| TPC-H (Colocated) | 77.27% | 45.45% | 72.73% |
| TPC-H (Distributed) | 81.82% | 45.45% | N/A |
| JOB (Colocated) | 60.18% | 30.97% | 42.48% |
| JOB (Distributed) | 61.06% | 30.97% | N/A |
Note: for the new CBO, we have run ANALYZE to collect statistics and enabled the new cost model using SET yb_enable_base_scans_cost_model = ON; command.
The first thing to note is that even PostgreSQL 15 is unable to achieve very high efficacy rates, especially for Join Order Benchmark. This reiterates that query planning is challenging, and also shows the strength of the TAQO framework in testing the efficacy of our new CBO.
The result also shows that the YugabyteDB CBO outperforms PostgreSQL. In some cases, it is easier to find the best plan on YugabyteDB. Network communication is often the bottleneck and the dominating factor in determining the throughput of the queries in YugabyteDB. If we model the network costs accurately then we are likely to find the optimal execution plan. This also means that the performance penalty of picking a suboptimal plan on YugabyteDB can be higher compared to PostgreSQL.
Query Performance Improvements
The following graphs show histograms of the number of queries and the factor of speedup (or slow-down) with the new cost model, compared to the default configuration in YugabyteDB 2024.1.
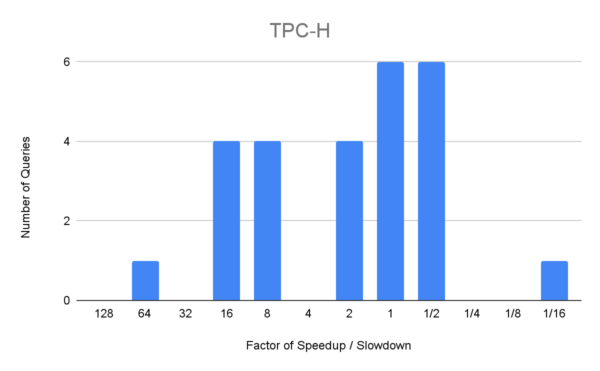
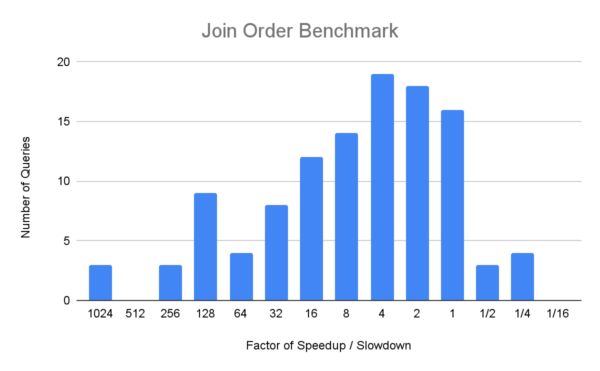
Notice that the speed up factor on the x-axis is on a logarithmic scale. This chart shows that for 3 queries in Join Order Benchmark, with the new cost model we get an execution plan that is more than 1024x faster than the plan with the default configuration. We also note that even in cases where we don’t find the best plan, we find better plans using the new cost model than without it.
This chart also illustrates that we have a few regressions where we produce worse plans using the new cost model. Some of the queries in the 1/2x buckets are not really regressions, but are affected by slight variations in test runs. However, we are tracking a handful of real regressions in both benchmarks. In particular, one query in TPC-H now runs almost 11 times slower with the new cost model enabled.
Incorrect selectivity estimations lead to a poor plan choice. The PostgreSQL query planner is known to suffer from underestimation of selectivity. It is not obvious how these issues should be resolved. One way to improve selectivity estimates is by creating extended statistics using the CREATE STATISTICS command. We are still testing if this can improve performance in our tests. Additionally, we continue working on ways to improve the accuracy of the cost model.
Here is a summary of the overall speed improvement YugabyteDB achieves in the two benchmarks.
| Benchmark | Speedup |
|---|---|
| TPC-H (Colocated) | 2.9x |
| TPC-H (Distributed) | 2.9x |
| JOB (Colocated) | 9.5x |
| JOB (Distributed) | 7.4x |
The speedup reported here is the ratio of the geometric mean of the runtimes of all the queries in the benchmark with the new cost model, compared to the default configuration.
Conclusion
This blog highlighted some of the challenges we have tackled while developing the new cost model and explained how some of the most impactful aspects of YugabyteDB are modeled. We detailed our validation approach and presented results from benchmarks that show significant performance improvements compared to the old cost model.
The new cost model along, with the TAQO framework, provides a strong foundation for future improvements. We will continue to focus on improving the CBO performance and expanding our test coverage.
We would like to invite you to try the new cost model and would be grateful for any feedback. To enable the new cost model on your workloads, use the following steps:
- Collect statistics using
ANALYZE
As mentioned earlier, statistics are not collected automatically in the current YugabyteDB release. Work is ongoing to automate the collection of statistics and to improve the performance of theANALYZEoperation.You can useANALYZEcommand as follows,ANALYZE [table [, ...]];
You can specify table names to collect or refresh statistics for selective tables. When no table name is specified, column statistics are collected for all tables in the current database.
- Enable
yb_enable_base_scans_cost_modelThe new cost model is currently disabled by default. It can be enabled by setting the GUC parameter as follows.
-- Enable for current session
SET yb_enable_base_scans_cost_model = TRUE;

-- Enable for all new sessions of a user
ALTER USER user SET yb_enable_base_scans_cost_model = TRUE;

-- Enable for all new sessions on a database
ALTER DATABSE database SET yb_enable_base_scans_cost_model = TRUE;
Want to Learn More?
If you’d like to learn more about the Cost Based Optimizer on YugabyteDB, click here to watch our recent YFTT. Plus, follow the Yugabyte blog for posts on this topic.
Cost Based Optimizer: Frequently Asked Questions
What is the difference between cost-based and rule-based optimizer?
A cost-based optimizer chooses the best query execution plan by evaluating possible execution strategies using data statistics such as table statistics and column statistics to estimate costs like CPU, I/O, and memory usage. In contrast, a rule-based optimizer applies a fixed set of rules (e.g., “use index if available”) without considering actual data distribution. Cost-based optimization generally leads to better query performance because it adapts to real statistics collection rather than fixed heuristics.
What is the cost optimizer model?
The cost optimizer model is an analytical framework within the database server that assigns cost estimations to multiple potential query execution plans. It uses table and column statistics to estimate factors like row counts, I/O, and memory usage, then selects the plan with the lowest cost to improve query execution and overall SQL query performance.
What is an example of cost optimization?
An example of cost optimization in a database is updating statistics collection on large tables so the optimizer can choose a better query execution plan. For instance, having accurate data statistics enables the cost-based optimizer to decide between a full table scan or an index seek, reducing unnecessary I/O or memory usage and significantly improving query performance.
Are cost-based optimizers harder to maintain?
Yes, cost-based optimizers can be harder to maintain because they depend on accurate statistics collection and correct table statistics and column statistics. If data statistics are outdated, the query optimizer may make poor cost estimations, leading to suboptimal query execution plans and worse query performance, so regular maintenance and monitoring are required.

