Agentic AI Operational Efficiency: Achieving Smarter Observability with YugabyteDB Performance Advisor
August 26, 2025
YugabyteDB Aeon recently introduced Performance Advisor, a powerful new tool that brings intelligent observability directly into your distributed Postgres-compatible database. In this blog, we’ll dive into new YugabyteDB Performance Advisor features (currently available in tech preview) and demonstrate how it can help your teams to:
- Optimize database performance faster
- Make observability active, not passive
- Cut through alert noise and fix issues faster
- Spend more time innovating, not mitigating
Smarter Insights, Not Just More Data
Traditional monitoring tools bombard you with metrics and alerts, often leaving you sifting through the noise rather than finding answers. Challenges include:
- Cluttered dashboards full of ambiguous metrics
- Overactive alerting systems that either spam you or miss critical issues
- Data overload and false positives that lead to alert fatigue
Performance Advisor flips the script with a unified cluster load chart that makes it easy to monitor whether your system is idle, busy, or bottlenecked. Load is color-coded by activity type, so you can see at a glance whether your database is efficiently using CPU, waiting on I/O, blocked on locks, or facing other resource constraints.
The interface provides two powerful views of the load chart:
- One correlates load with the top SQL queries, helping you trace performance impact to specific workloads.
- The other links load to detected anomalies, providing structured, actionable insights grounded in real system behavior.
Performance Advisor continuously scans for anomalies across your cluster, surfaces root causes, and guides you through deep, intuitive drilldowns. This means it provides clear, visual answers instead of guesswork.
Key Capabilities
Performance Advisor transforms database observability by automatically correlating performance data across your entire YugabyteDB cluster. It enables rapid identification of issues, whether they stem from individual queries, node-level resource constraints, database configuration problems, or application-level inefficiencies.
This comprehensive approach ensures performance issues don’t go undetected, regardless of where they originate in your distributed database environment.
Two Comprehensive Views
Performance Advisor introduces two intuitive new views under the Performance Advisor menu:
- Anomalies – Provide cluster-wide anomaly detection across multiple layers:
- SQL level: Query execution and optimization issues
- Node level: Infrastructure and system-level problems
- Database level: Database engine and storage anomalies
- Application level: Application-tier performance issues
- Queries – Focus specifically on SQL and CQL performance analysis, surfacing the top query contributors to cluster load and latency with detailed execution metrics and wait state breakdowns.
This holistic approach identifies systemic issues, performance bottlenecks, and hotspots wherever they occur in your distributed database stack.
The following image shows the two new views, Anomalies and Queries, under the Perf Advisor menu.
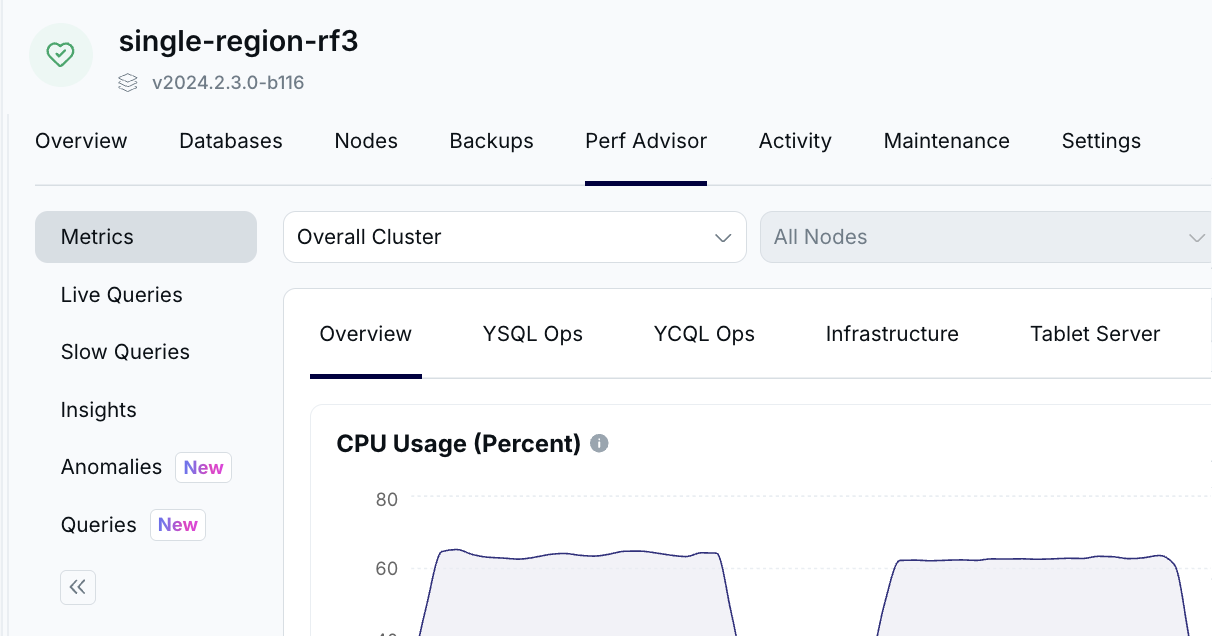
1. Anomalies
The Anomalies view has two parts:
- Cluster Load Chart
- Detected Anomalies
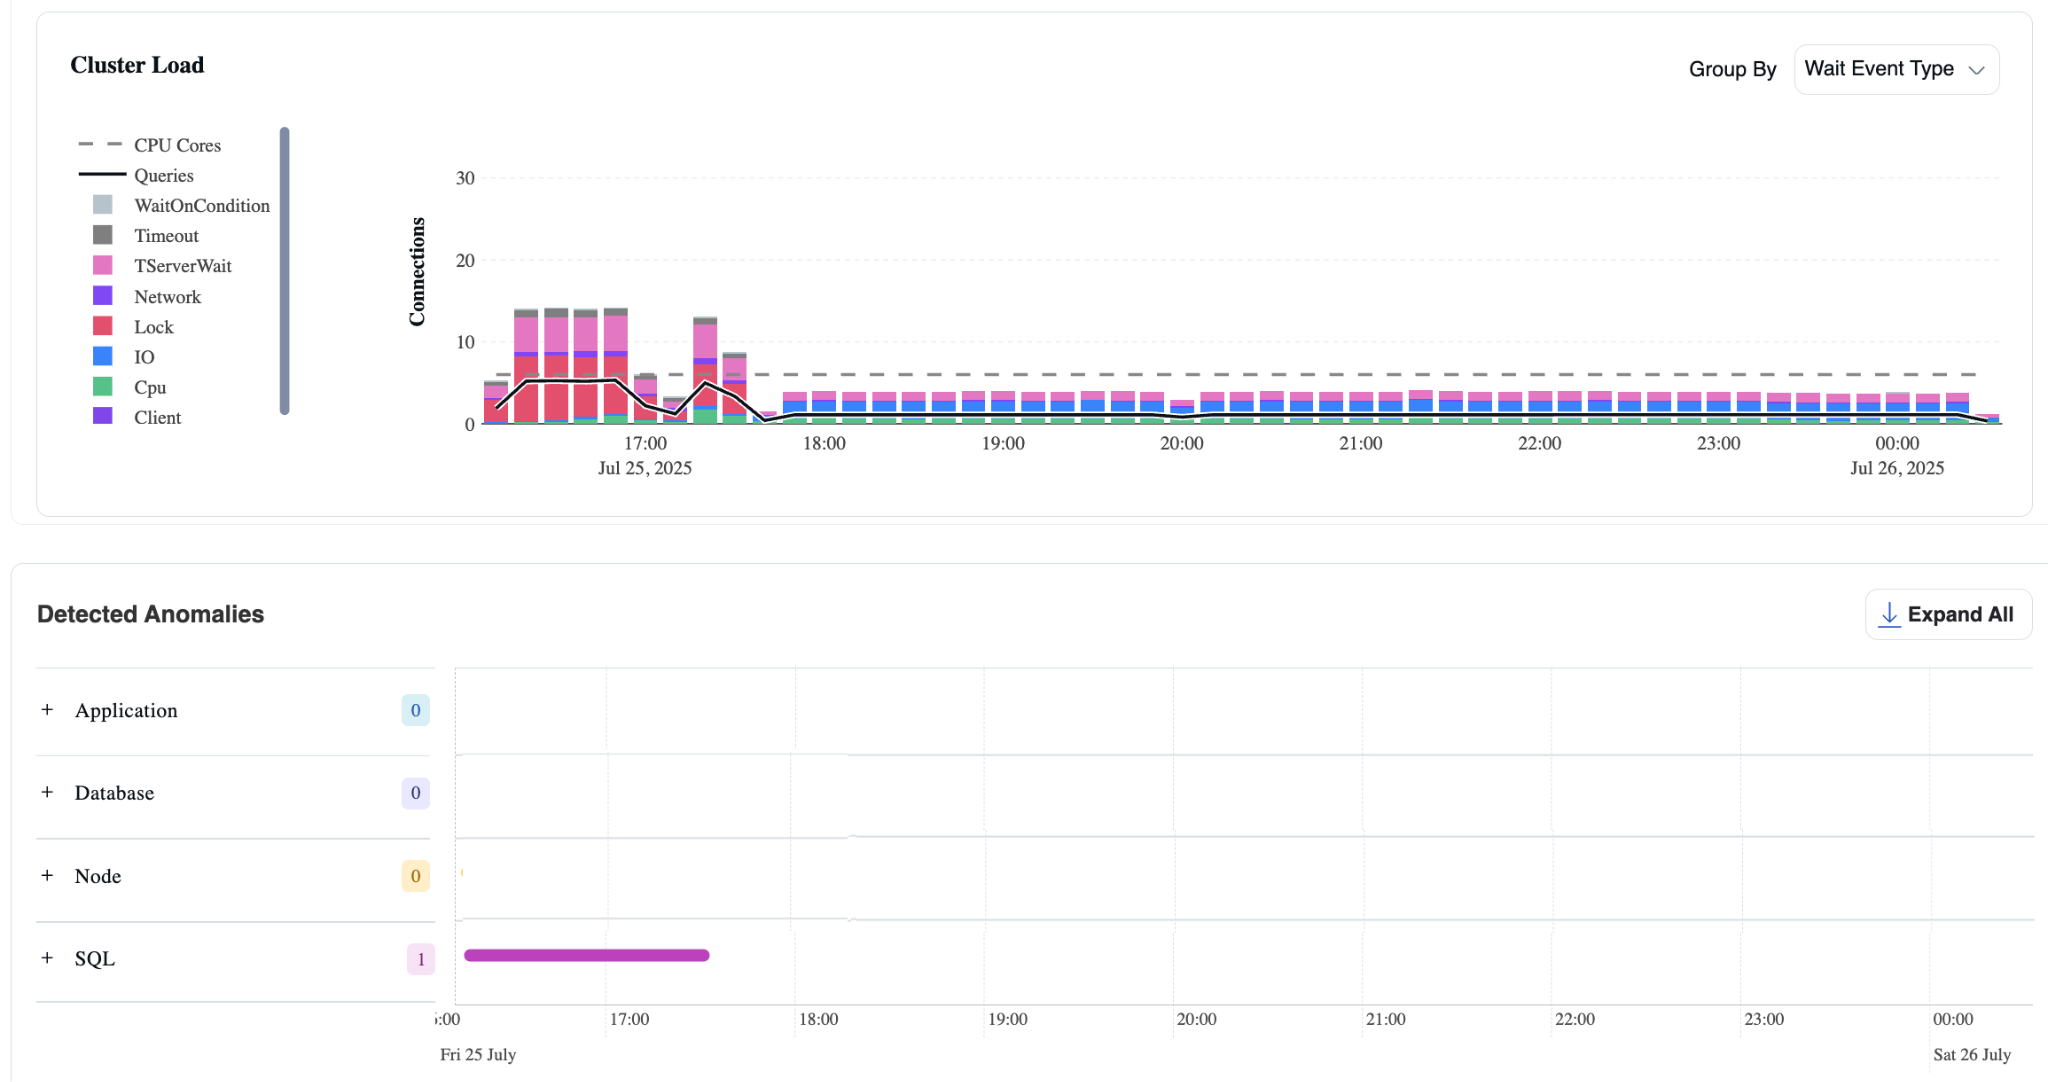
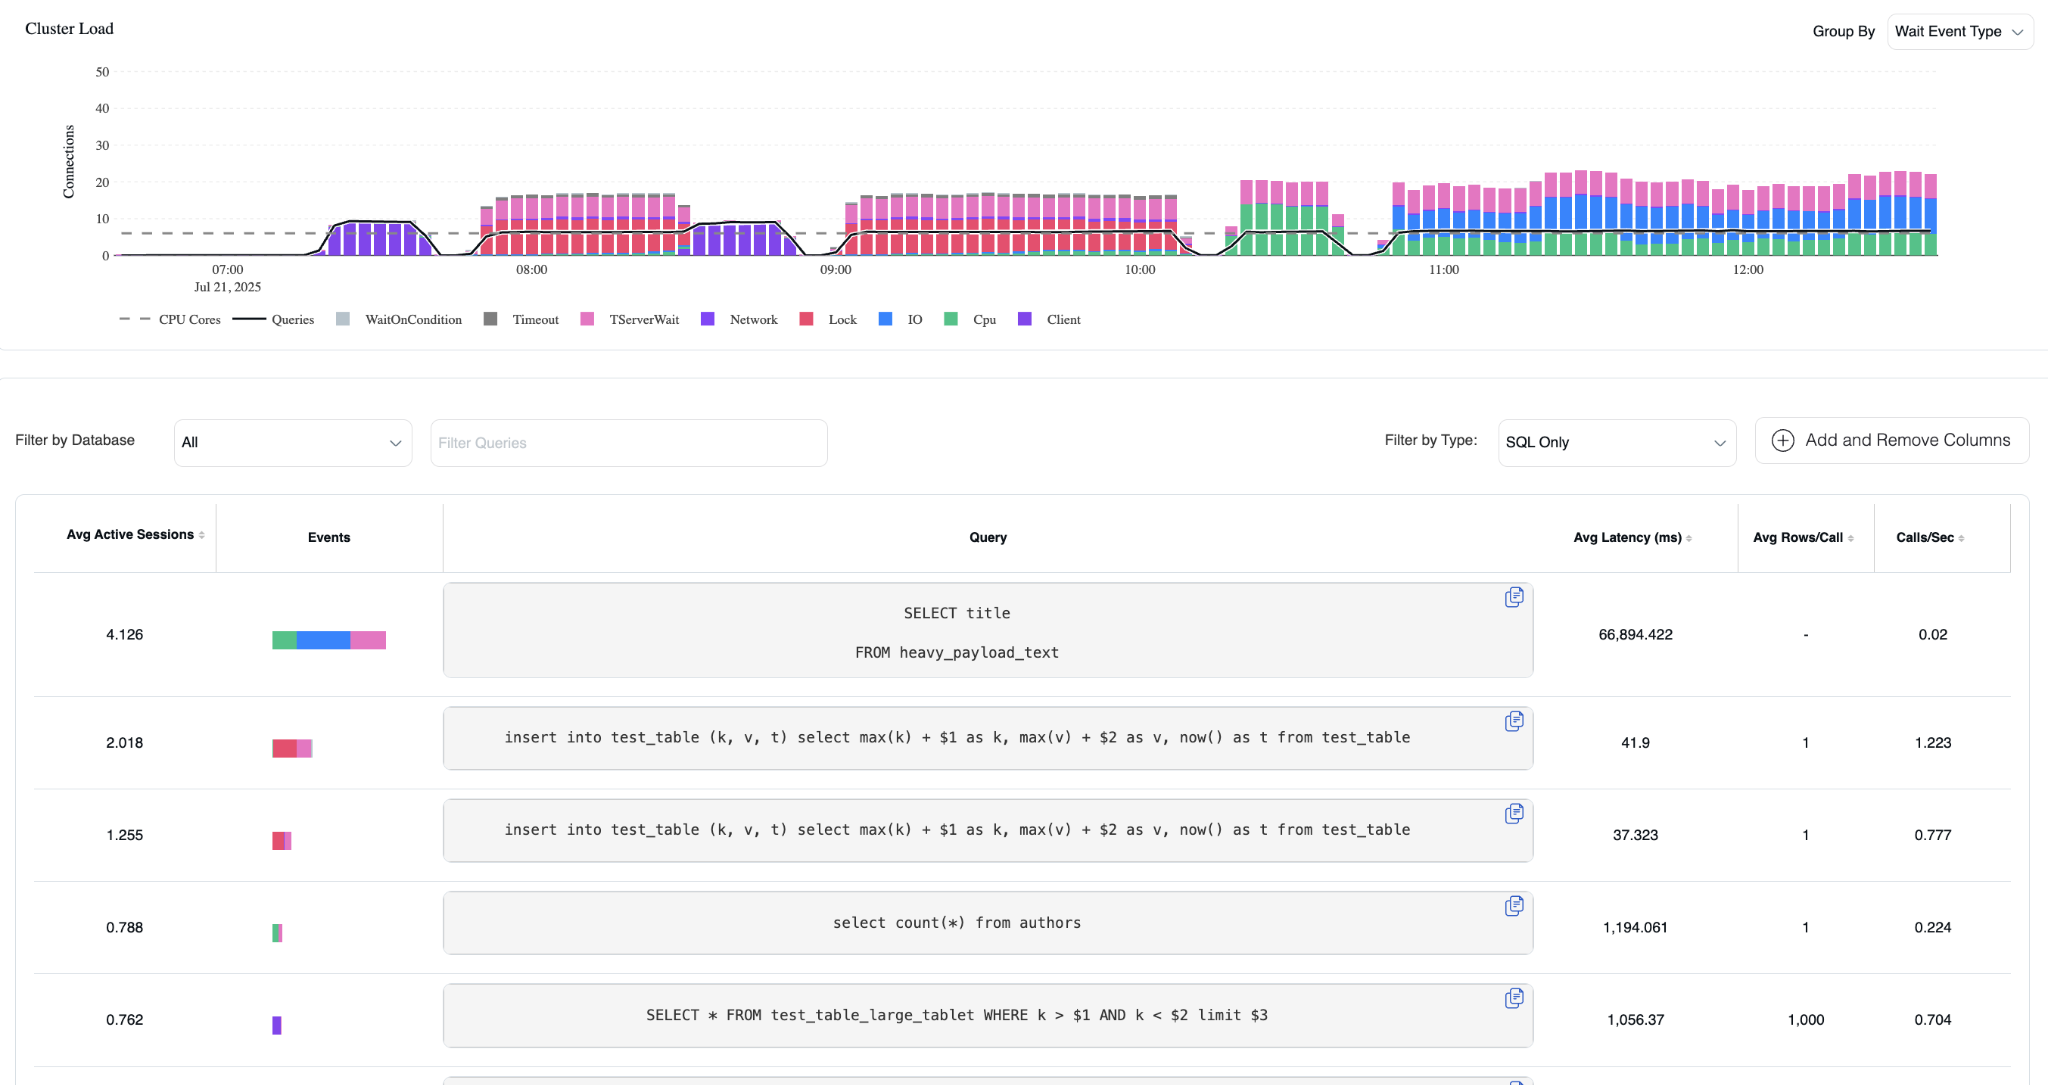
Cluster Load Chart
The Cluster Load Chart is built on top of PostgreSQL’s pg_stat_activity table, which maintains a row for each connection to the database. For active connections, it tracks the executing user, the running query, and the query’s current wait state-such as CPU, IO, Lock, or another condition.
A query is typically in the “CPU” state when it’s actively executing on the processor. Otherwise, it may be waiting for disk I/O (e.g., reading from storage), blocked by another query’s lock, or stalled on some other resource. These are known as wait events.
To enhance visibility into distributed performance, YugabyteDB has extended PostgreSQL with additional wait events tailored to its architecture. It also introduces a new table: yb_active_session_history (ASH). This table samples pg_stat_activity once per second and records key information like the user, query text, and wait state.
The Cluster Load Chart uses this ASH data to display the average number of active sessions across all nodes in the cluster, grouped by wait state, giving users a real-time view into workload behavior and system health.
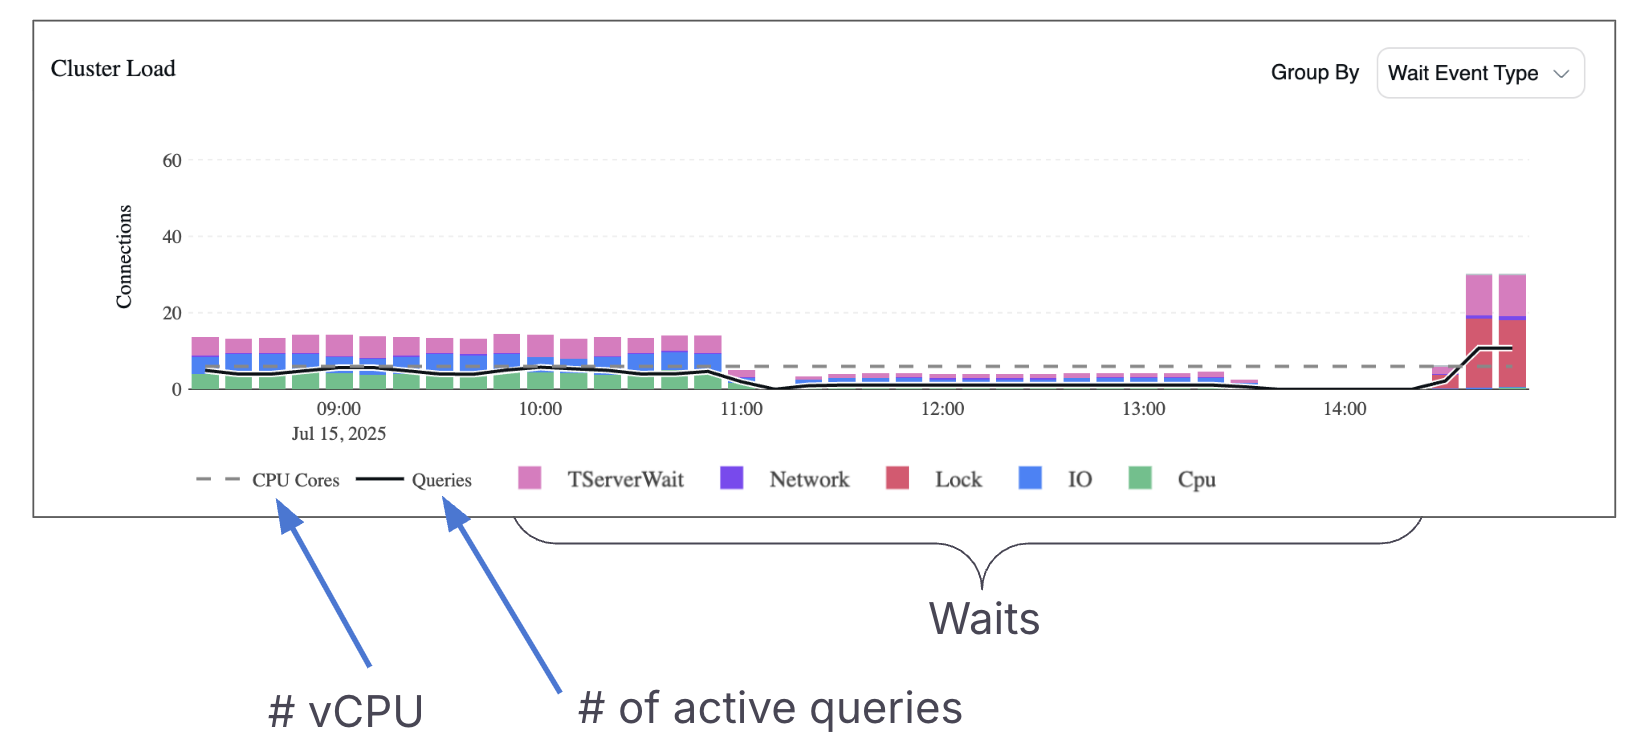
The height of each bar in the Cluster Load Chart represents the total number of active connections across the cluster.
The color of each segment indicates what those connections are doing, whether they’re on CPU, waiting on IO, blocked on locks, experiencing network delays, or in other states.
A key detail in YugabyteDB’s architecture is that each query is typically handled by multiple connections. The initial connection goes to the typical Postgres process. From there, the query is forwarded to a thread on the local tserver (tablet server).
The local tserver forwards the query to tserver(s) on the node(s) that own the relevant data. If the query touches data spread across multiple nodes, several tservers may be involved simultaneously, meaning a single query spans two or more active connections.
To account for this, the chart includes a black line representing the number of distinct active queries. By comparing the black line to the height of the bars, you can estimate how many connections are involved per query on average.
Another important visual indicator is the “CPU cores” line, which reflects the total number of vCPUs available across the cluster.
This line represents the maximum number of queries that can be actively running on CPU at once. If the number of CPU-bound connections exceeds the CPU core count, it means some queries are waiting for CPU time-highlighting potential resource contention.
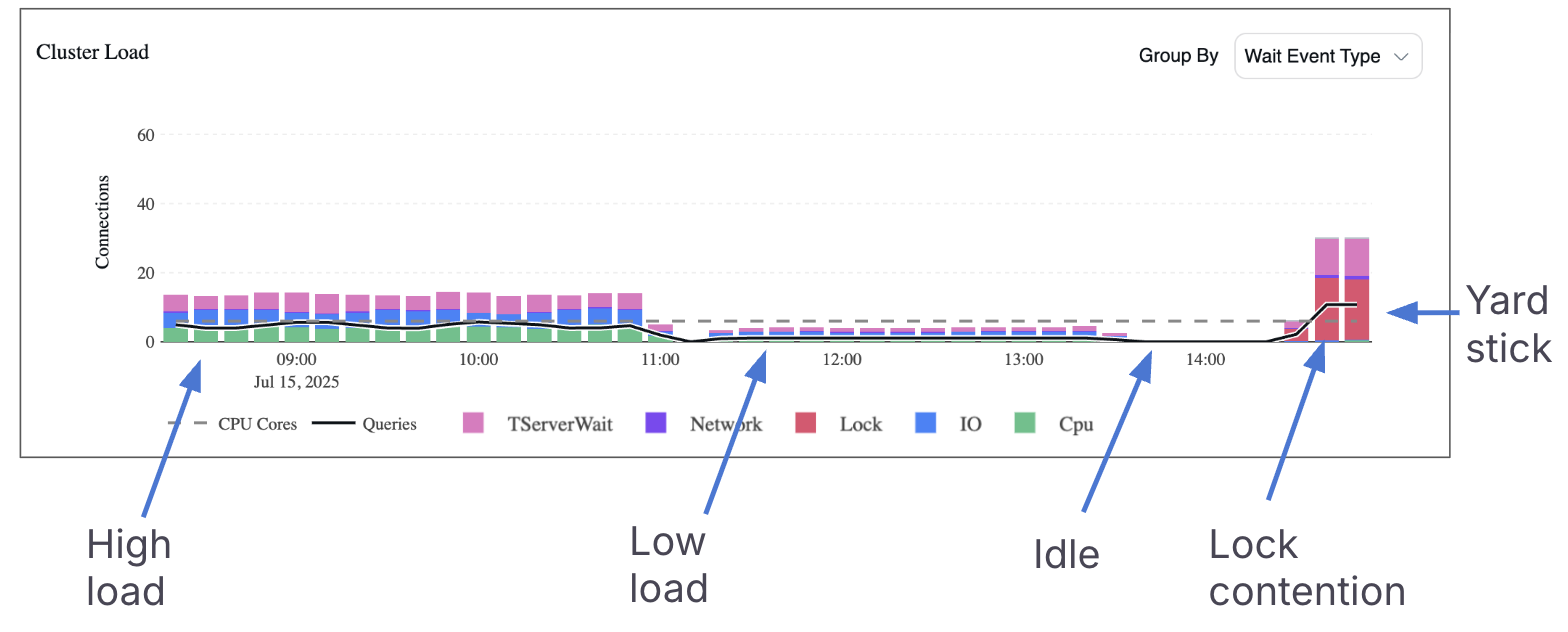
In the example above, the Cluster Load Chart reveals several distinct workload patterns:
- Left side: The number of active connections is more than twice the number of vCPUs, indicating the cluster is under high load.
- Middle section: The load is comfortably below the vCPU line, suggesting the cluster has ample headroom to handle more queries without performance degradation.
- Middle-right: The chart is completely empty, which indicates that either no queries were running, or those that did run completed too quickly to leave a measurable footprint. If users report slow latency during this time, the problem is likely outside the database, such as in the application layer or network.
- Far right: There’s a sharp spike, and the bars are mostly red, which represents lock contention. This means many queries were waiting on user locks, causing a noticeable slowdown in workload execution.
Detected Anomalies
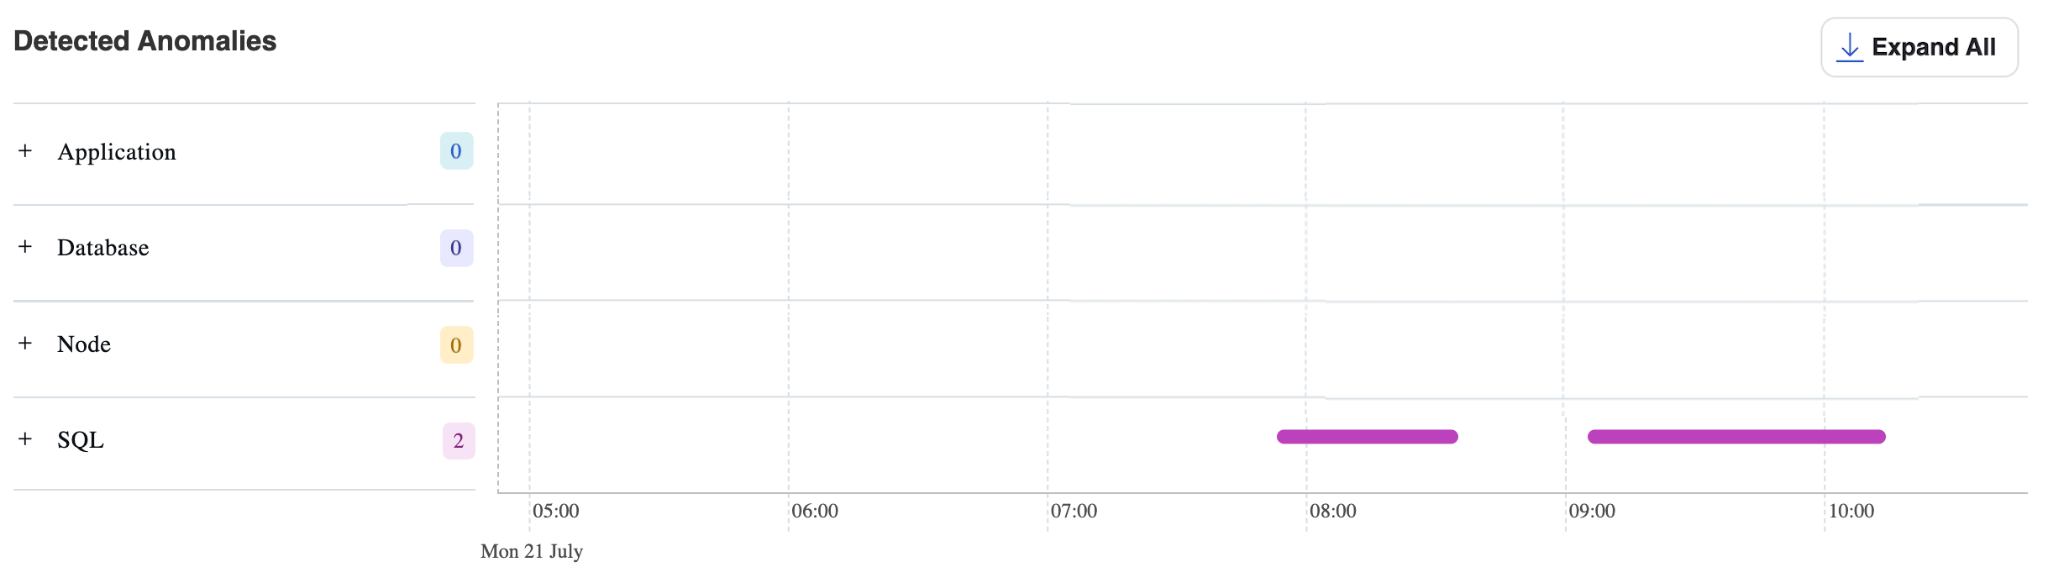
As seen in the cluster load chart, there were waits on locks. When queries spend a significant portion of their time waiting on locks, these events are surfaced in the Detected Anomalies table.
In the example above, the “SQL” section displays a magenta bar, which marks the time window during which the anomaly was detected. Each section in the left-hand panel is expandable, allowing you to explore the specific queries involved and understand the root cause in more detail.
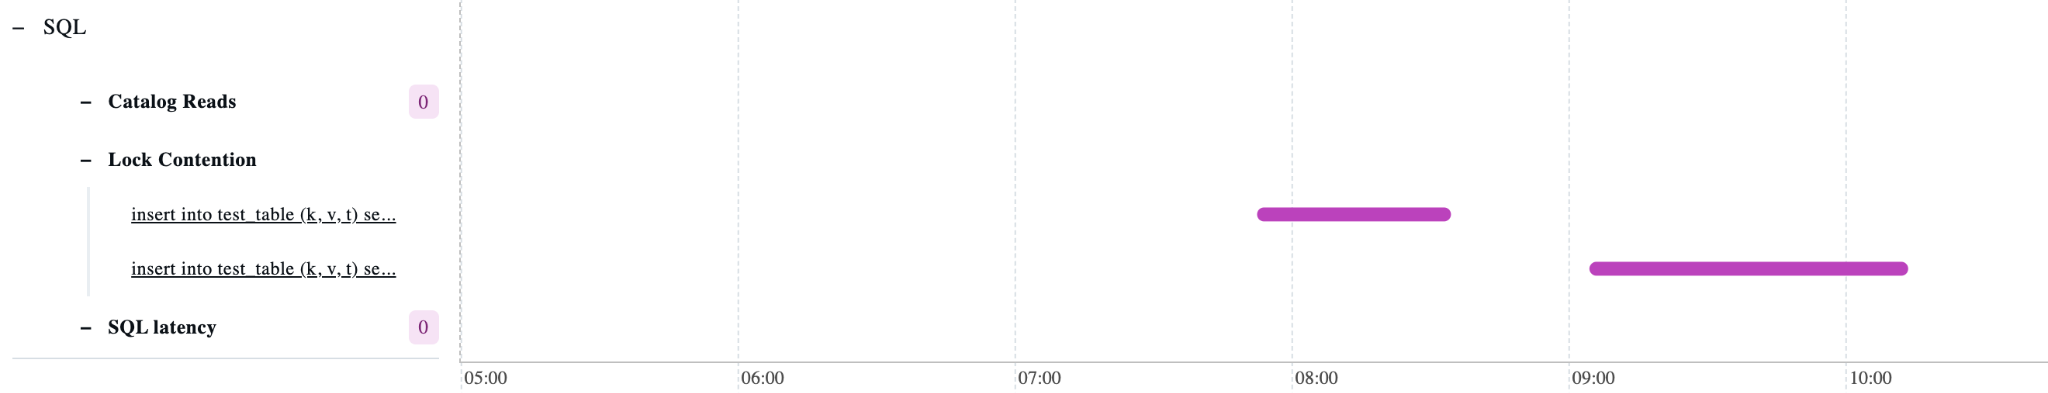
SQL Anomaly Detection
The SQL section monitors three types of performance anomalies:
- Catalog Read Anomalies
- Detection threshold: Queries spending >50% of execution time waiting for catalog reads
- Root cause: Occurs when retrieving metadata required for query execution, such as table definitions and schema information
- Optimization: This wait time can be eliminated by implementing proper metadata caching strategies
- Lock Contention Anomalies
- Detection threshold: Queries spending >50% of execution time waiting for locks
- Impact: Indicates resource contention that can significantly degrade query performance
- Example: The screenshot shows two queries experiencing lock contention waits in this category
- SQL Latency Anomalies
- Detection threshold: Consistently running queries whose latency doubles or exceeds baseline performance
- Purpose: Identifies queries experiencing unexpected performance degradation over time
Anomaly Dashboard Overview
The Detected Anomalies section organizes findings into four categories:
- Application – Application-level performance issues
- Database – Database engine and storage anomalies
- Node – Infrastructure and system-level problems
- SQL – Query execution and optimization issues
Dashboard Elements
- Anomaly count: The tile next to each section name displays the number of detected anomalies in that category
- Timeline visualization: The horizontal bar shows the time period during which each anomaly was active
- Expandable sections: Each category can be expanded to view detailed information about individual anomalies within that group
This structured approach enables rapid identification and prioritization of performance issues across different layers of the database stack.
2. Queries
Queries Tab
The Queries view provides detailed SQL-level performance analysis. It features the same cluster load chart at the top, but with an enhanced view of the specific queries driving system load.
Query Performance Analysis
Below the load chart, SQL statements are ranked by their relative impact on cluster performance. This prioritized view enables rapid identification of the most resource-intensive queries affecting system performance.
Visual Load Breakdown
- Load ranking: Queries are ordered by their contribution to the overall cluster load
- Wait state visualization: The colored bar adjacent to each SQL statement displays the specific wait states for that query
- Resource attribution: For example, in the current view:
- The top query accounts for nearly all I/O (blue)
- The subsequent INSERT statements are primarily responsible for lock contention waits (red)
Drill-Down Capabilities
Each query entry is interactive, allowing users to:
- Click to drill into details: Access detailed SQL performance metrics and analysis
- Historical trends: View query performance patterns over time
- Granular monitoring: Leverage pg_stat_statements data collected at one-minute intervals for precise performance tracking
Data Collection Framework
Performance Advisor continuously gathers metrics from PostgreSQL’s pg_stat_statements extension, providing:
- Real-time insights: Minute-by-minute performance data collection
- Trend analysis: Historical performance patterns to identify degradation or improvement
- Comprehensive coverage: Complete visibility into query execution statistics and resource utilization
This detailed query-level analysis enables database administrators to quickly identify, prioritize, and resolve performance bottlenecks at the SQL level.
Conclusion
Performance Advisor represents a major leap forward in observability, turning noisy metrics into actionable insights. From real-time load charts to anomaly detection and query-level diagnostics, it allows tech teams to solve performance issues faster and spend more time building their applications.
This feature is currently available as a tech preview in YugabyteDB Aeon on clusters running version 2024.2 or higher. On-prem support via YugabyteDB Anywhere (YBA) is also coming soon. To enable Performance Advisor for your clusters, please contact YugabyteDB Support.
Want to learn how you can build robust AI applications? Discover the benefits of the new and enhanced AI functionality introduced in the latest YugabyteDB release.


