How to Monitor YugabyteDB with Prometheus on Docker?
February 12, 2019
Observability is absolutely vital to operating business-critical data infrastructure at scale. This is why observability is not an afterthought in the YugabyteDB architecture. Every layer of YugabyteDB exposes metrics in the Prometheus format at the /prometheus-metrics endpoint. Given that Prometheus is essentially the de-facto standard for build-your-own infrastructure monitoring and alerting, you can get started with monitoring YugabyteDB in almost no time.
This post details how to install and configure both YugabyteDB and Prometheus on Docker so that you can run simple queries on the Prometheus UI. A follow-up post will go through each layer of YugabyteDB (including API implementation, query layer, core DB server, DocDB document store as well as underlying node CPU/disk resources) and highlight the top metrics that matter for ensuring high performance.
Install YugabyteDB
mkdir ~/yugabyte && cd ~/yugabyte
wget https://downloads.yugabyte.com/yb-docker-ctl && chmod +x yb-docker-ctl
Create a YugabyteDB Cluster
$ ./yb-docker-ctl create
Run Sample Key-Value Workload
Run a simple key-value workload in a separate shell.
$ docker cp yb-master-n1:/home/yugabyte/java/yb-sample-apps.jar .
$ java -jar ./yb-sample-apps.jar --workload CassandraKeyValue \
                                    --nodes localhost:9042 \
                                    --num_threads_write 1 \
                                    --num_threads_read 4 \
                                    --value_size 4096
Prepare Prometheus Config File
Copy the following into a file called yugabytedb.yml. Move this file to the /tmp directory so that we can bind the file to the Prometheus container later on.
global:
  scrape_interval:     5s # Set the scrape interval to every 5 seconds. Default is every 1 minute.
  evaluation_interval: 5s # Evaluate rules every 5 seconds. The default is every 1 minute.
  # scrape_timeout is set to the global default (10s).

# YugabyteDB configuration to scrape Prometheus time-series metrics
scrape_configs:
  - job_name: 'yugabytedb'
    metrics_path: /prometheus-metrics

    static_configs:
      - targets: ['yb-master-n1:7000', 'yb-master-n2:7000', 'yb-master-n3:7000']
        labels:
          group: 'yb-master'

      - targets: ['yb-tserver-n1:9000', 'yb-tserver-n2:9000', 'yb-tserver-n3:9000']
        labels:
          group: 'yb-tserver'

      - targets: ['yb-tserver-n1:11000', 'yb-tserver-n2:11000', 'yb-tserver-n3:11000']
        labels:
          group: 'yedis'

      - targets: ['yb-tserver-n1:12000', 'yb-tserver-n2:12000', 'yb-tserver-n3:12000']
        labels:
          group: 'ycql'

      - targets: ['yb-tserver-n1:13000', 'yb-tserver-n2:13000', 'yb-tserver-n3:13000']
        labels:
          group: 'ysql'
Start Prometheus Server
Start the Prometheus server as below. The `prom/prometheus` container image will be pulled from the Docker registry if not already present on the localhost.
$ docker run \
-p 9090:9090 \
-v /tmp/yugabytedb.yml:/etc/prometheus/prometheus.yml \
--net yb-net \
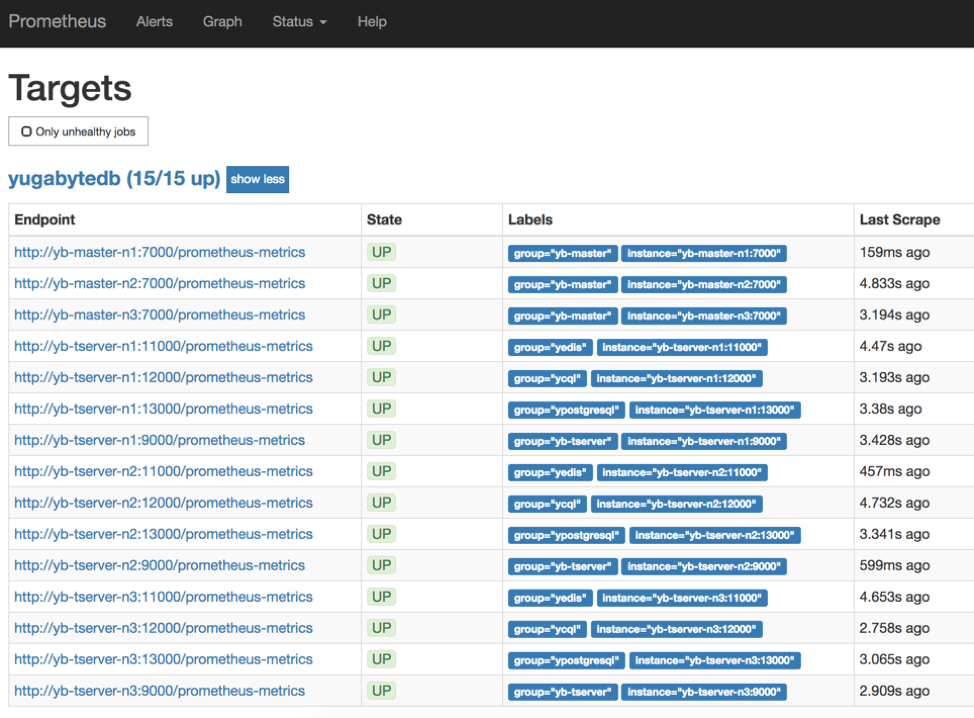
prom/prometheusOpen the Prometheus UI at https://localhost:9090 and then navigate to the Targets page under Status.
Analyze Key Metrics
On the Prometheus Graph UI, you can now plot the read/write throughput and latency for the CassandraKeyValue sample app. As we can see from the source code of the app, it uses only SELECT statements for reads and INSERT statements for writes (aside from the initial CREATE TABLE). This means we can measure throughput and latency by simply using the metrics corresponding to the ELECT and INSERT statements.
Paste the following expressions into the Expression box and click Execute followed by Add Graph.
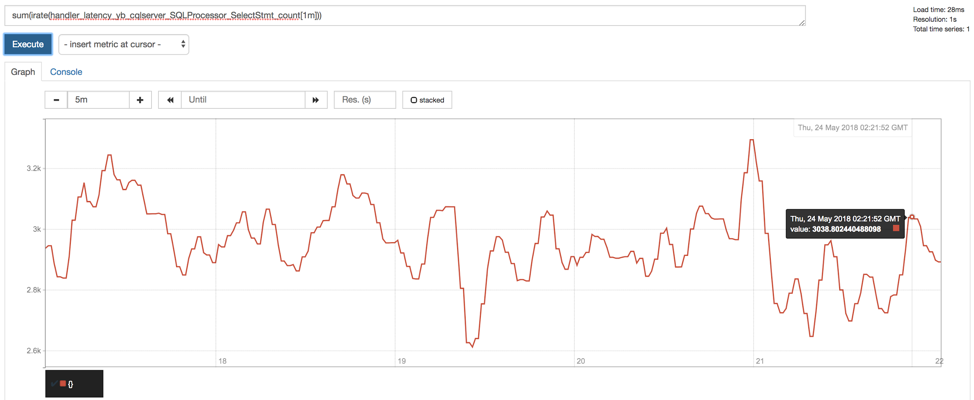
Throughput
Read IOPS
sum(irate(handler_latency_yb_cqlserver_SQLProcessor_SelectStmt_count[1m]))
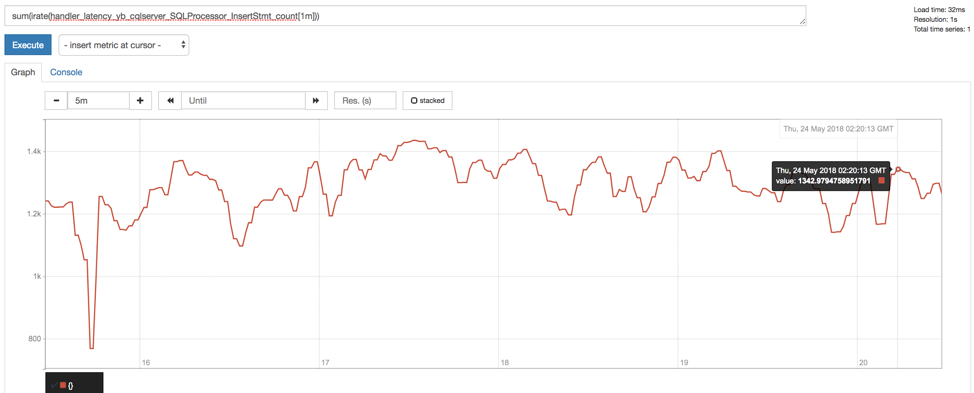
Write IOPS
sum(irate(handler_latency_yb_cqlserver_SQLProcessor_InsertStmt_count[1m]))
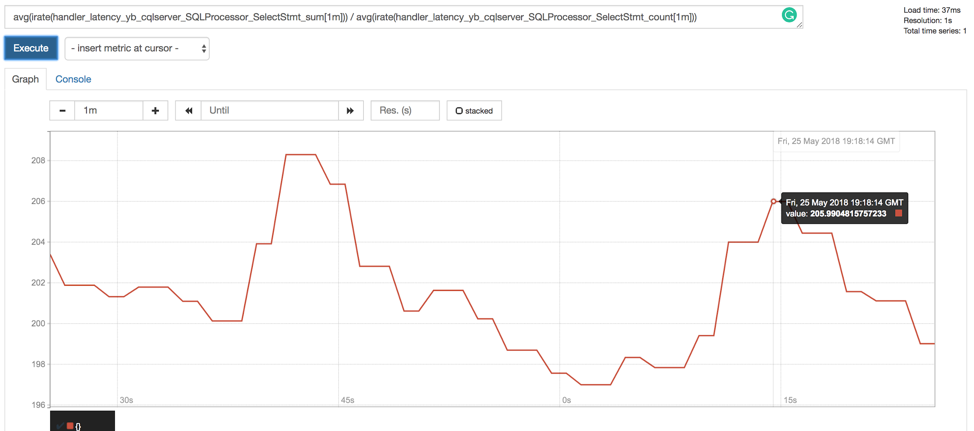
Latency
Read Latency (in microseconds)
avg(irate(handler_latency_yb_cqlserver_SQLProcessor_SelectStmt_sum[1m])) / avg(irate(handler_latency_yb_cqlserver_SQLProcessor_SelectStmt_count[1m]))
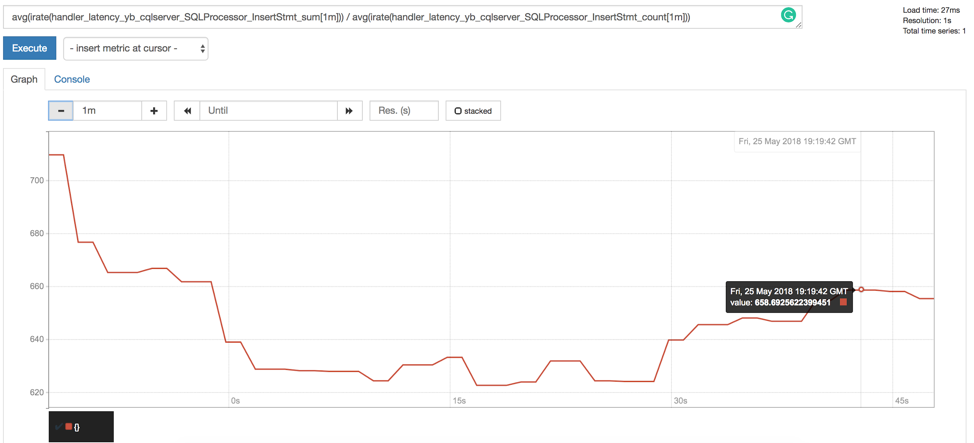
Write Latency (in microseconds)
avg(irate(handler_latency_yb_cqlserver_SQLProcessor_InsertStmt_sum[1m])) / avg(irate(handler_latency_yb_cqlserver_SQLProcessor_InsertStmt_count[1m]))
Delete Cluster (Optional)
Optionally, you can shutdown the local cluster created in Step 1.
$ ./yb-docker-ctl destroy
Summary
Getting started with YugabyteDB and Prometheus on Docker is extremely simple as highlighted in this post. If you are interested in doing the same on macOS or Linux, then instructions are available in documentation. We look forward to the next post in this series where we will look into the top metrics that matter for each layer of YugabyteDB.
What’s Next?
- Compare YugabyteDB in depth to databases like MongoDB, CockroachDB and Amazon DynamoDB.
- Get started with YugabyteDB on macOS, Linux, Docker and Kubernetes.
- Contact us to learn more about licensing, pricing or to schedule a technical overview.


