How the YugabyteDB Performance Team Harnesses the Power of AI
January 5, 2026
If you’ve worked with databases or large systems, you know that performance matters.
The YugabyteDB performance team’s job is to ensure the database is fast and reliable, whether it’s handling a few thousand operations per second or many millions. To achieve this, they regularly run benchmarks that cover a broad range of workloads, including read-heavy, write-heavy, index-focused, and multi-region scenarios.
As the performance infrastructure expanded, so did the volume of data it generated. What didn’t grow at the same pace was our ability to review it all reliably. In this blog, we share how the performance team addressed this gap by building two AI-driven systems: one focused on regression detection and the other on making performance knowledge easier to query and share, along with the lessons the team learned during the process.
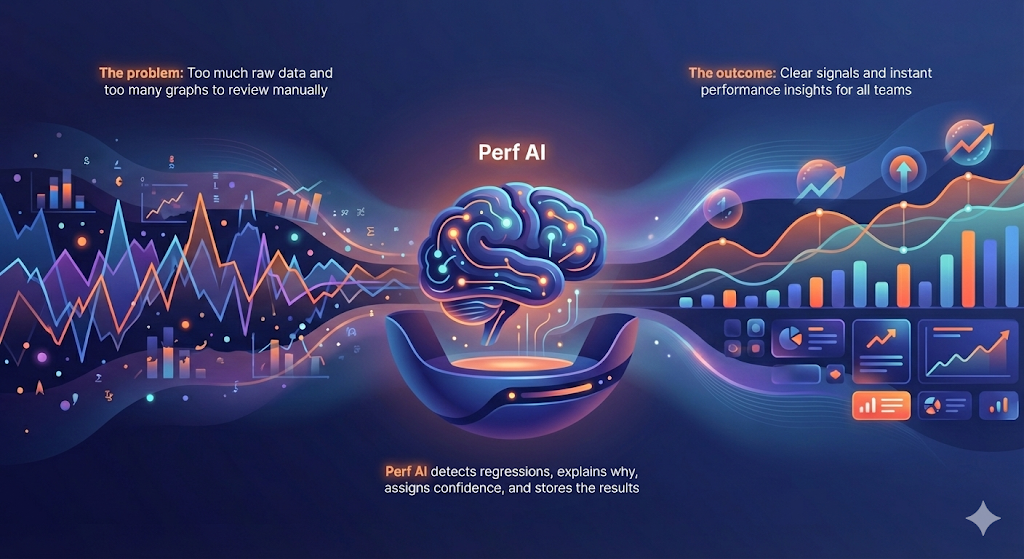
When the Performance Data Became “Too Much”
Running more benchmarks sounds great, until you need to analyze them all. Each run generates numerous metrics, including latency percentiles, throughput, CPU usage, disk activity, index scans, and other key performance indicators.
Traditionally, we visualize these results using graphs. And for a long time, that worked fine.
But every new commit to the code triggers a nightly regression run. Which means fresh data, fresh graphs, and fresh questions every single day.
The team realized they had two separate but related problems.
- Too many graphs to accurately review
A nightly regression suite can generate 400+ graphs. Each one tells a small part of the story: a latency spike, a throughput dip, or an unexpected CPU pattern. No human can examine that many graphs every day and reliably spot the subtle changes that matter.
Tiny regressions often hide behind small shifts. A slight bump in p99 latency. A minor dip in throughput. These are easy to miss unless you compare runs carefully, side by side.
Relying on manual inspection isn’t just slow; at this scale, it’s unreliable. - Too much data, not enough insight
Benchmarks produce far more than just graphs. They generate a vast amount of raw information, including metrics, logs, system statistics, run metadata, and historical context. The performance team might know how to read this, but it’s overwhelming for other teams across the business.Product managers, support engineers, and field teams don’t want to have to dig into dashboards. They want instant answers to key questions like:- Did performance improve?
- Why did latency spike?
- How does this compare to Postgres?
We had mountains of data, but lacked the ability to deliver it as clear, digestible answers.
The gap was obvious; the team needed a way to move beyond raw performance data to meaningful insight.
To find a solution to this challenge, we built two complementary AI systems:
- An autonomous regression analyst
- PerfInsights – a conversational interface powered by Retrieval-Augmented Generation (RAG)
What started life as an idea and an internal hackathon project is now a core part of how we build and ship performant software.
Use Case 1: AI as an Autonomous Regression Analyst
The goal was moving from “look at every graph manually” to “AI tells you exactly where something changed.”
Every performance run in the YugabyteDB pipeline generates a large set of metrics across workloads. This includes latency percentiles, throughput, CPU, disk, index scans, and distribution metrics. Historically, this data was plotted into 400+ graphs per branch, which engineers then compared against baselines to spot regressions.
That approach worked well at a small scale, but wasn’t practical for nightly runs across every commit.
Feeding the AI
Instead of providing charts or screenshots to the Autonomous Regression Analyst AI, we gave it the raw data.
For each benchmark, the system iterates over every metric and its time series, comparing the current run against reference runs. The model receives clean, structured JSON containing all values and historical context.
Because it has visibility into past behavior, the AI can determine whether a change is a regression, an improvement, or a normal variation.
We can also ask direct questions, such as:
“Given the data and its history, determine whether this change is a regression, an improvement, or expected variation. Use any statistical technique you believe is appropriate, and explain why.”
The model selects appropriate methods based on the data, including bootstrap confidence intervals, change-point detection, robust outlier checks for noisy workloads, or a combination when necessary. It must always justify and explain the choices it makes.
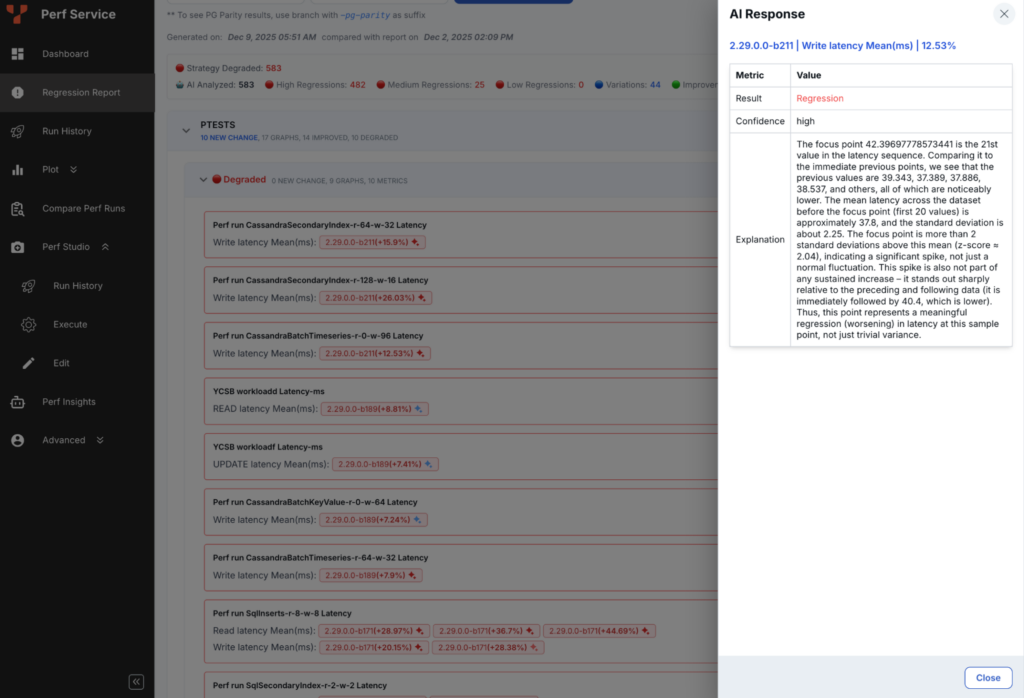
Simple, High-Signal Output
Each analysis produces a small, structured result:
- regression: true/false
- reason: short explanation
- confidence: for example, 0.87
- detector used
The confidence score provided by the AI is important. It informs engineers of the system’s confidence in the decision and helps with prioritization.
The Importance of Storing Metrics
Every regression decision is persisted in YugabyteDB’s performance database. The workload, metric, verdict, confidence, and explanation and stored after each run.
This process makes regression detection a first-class data signal, not a transient check. Reports no longer reprocess raw data; instead, they query the curated layer.
As a result:
- Daily reports surface AI-confirmed regressions, not raw charts
- Trends across workloads and metrics become easy to analyze
- Performance behavior is clear when compared across branches and releases
Avoiding the “Noise”
Before the AI agent was implemented, simple statistical checks generated too many false alarms. Roughly half of the reported regressions turned out to be noise.
After the AI-based analysis was rolled out, false positives dropped by 50% while still catching real regressions early. The manual triage effort has reduced significantly, allowing the team to focus on innovation instead.
What’s Next?
The Autonomous Regression Analyst AI agent is now part of YugabyteDB’s daily workflow, but some challenges still remain:
- Noisy workloads with high variance
- Inconsistent explanation quality in edge cases
- Continuous evolution as benchmarks change
For the next stage of this project, we plan to implement a lightweight review agent for borderline cases and enhance the system’s iterative capabilities as we learn from past outcomes and human feedback.
Use Case 2: Perf Insights, the AI Chatbot with Performance Knowledge
The second problem the YugabyteDB performance team faced related to sharing understanding.
Although mountains of valuable performance data were available, not everyone had the time or background to interpret it:
- Product managers wanted simple comparisons
- Field engineers needed explanations for customer scenarios
- Support teams wanted clarity
- Leadership needed the story behind the numbers
The team needed to make performance knowledge human, searchable, and conversational.
PerfInsights started life as a hackathon experiment, rather than a fully formed/scoped project, with the simple premise, `What if anyone in the company could ask the system performance questions in the same way they’d ask a teammate?`
The Power of PerfInsights
PerfInsights is a conversational AI assistant that answers performance-related questions using a mix of:
- benchmark results
- regression decisions
- documentation and analysis notes
- historical comparison data
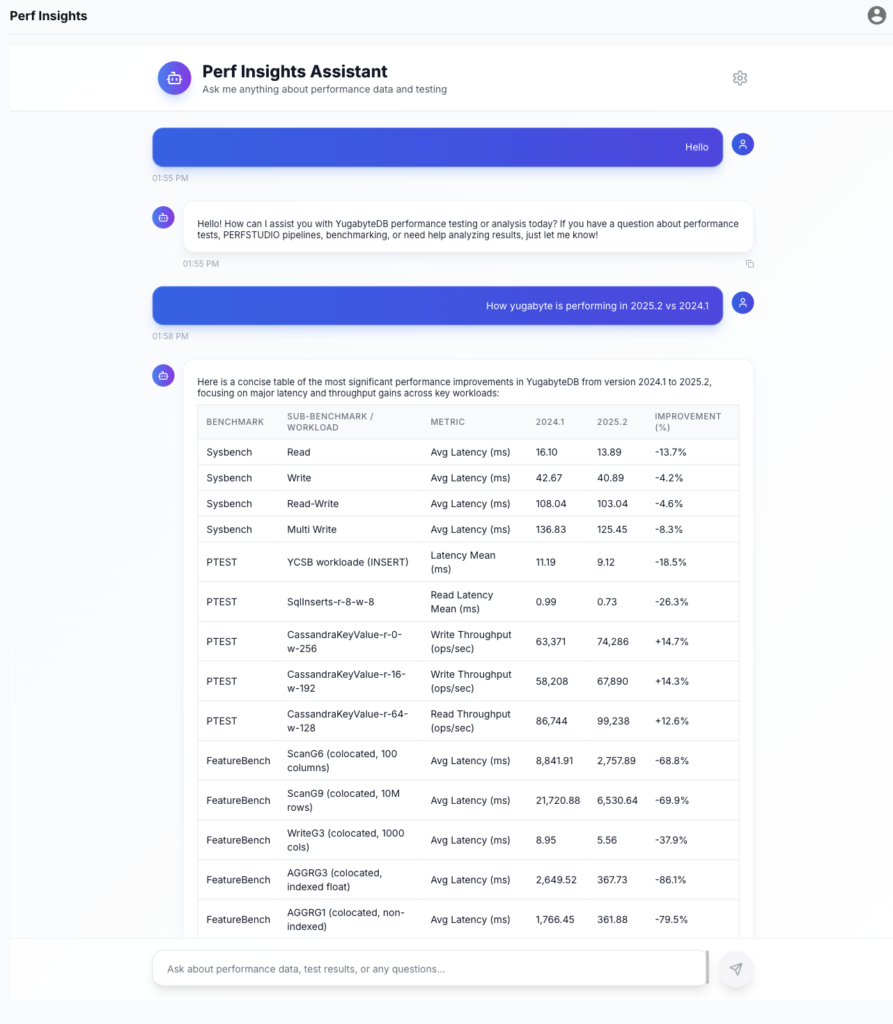
Instead of requiring people to hunt through dashboards or reports, PerfInsights lets them ask direct questions. For example, “How does YugabyteDB compare to Postgres on index-heavy workloads in the latest release?”
How PerfInsights Works
On the surface, PerfInsights appears to be a simple chat interface. However, behind the scenes, it’s a deliberately structured system.
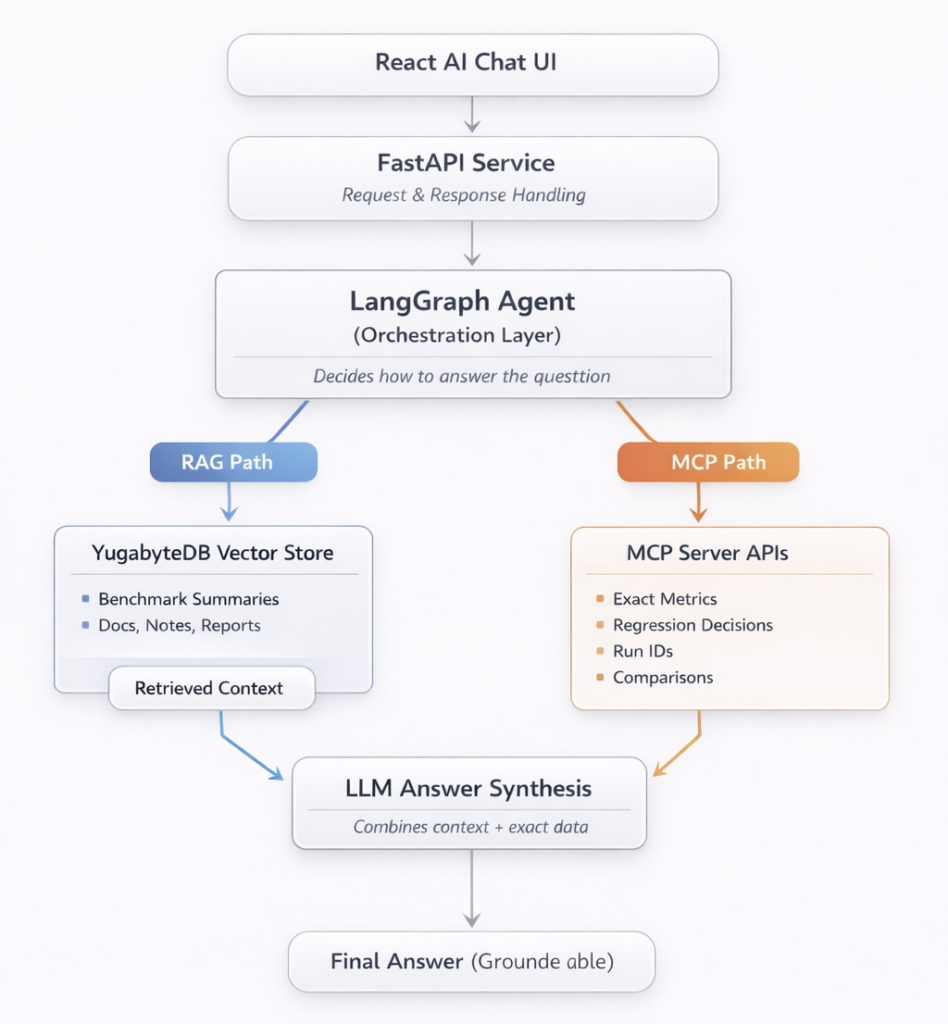
When a user asks a question, PerfInsights runs a LangGraph-based workflow that decides how to answer. Some questions are best answered from written context and summaries. Others require precise numbers from the performance database. Most questions need both.
Unstructured knowledge (context and reasoning)
For benchmark summaries, regression reports, commit descriptions, and historical reports, we use Retrieval-Augmented Generation (RAG) with YugabyteDB as the vector store.
Relevant documents are embedded and stored as vectors inside YugabyteDB. At query time, the vector search retrieves the most relevant content, allowing the model to reason with the correct background.
Structured data (facts and numbers)
For exact metrics, regression decisions, run IDs, and comparisons, PerfInsights talks to an MCP server.
The MCP server exposes a controlled set of APIs that allow the model to query internal performance systems safely and deterministically. This is how the AI retrieves actual values instead of guessing.
Answer synthesis
The final response combines:
- Retrieved context from the vector store
- Exact metrics and records from MCP-backed APIs
Under the hood, the LangGraph workflow is exposed as a service using FastAPI, with lightweight context memory to maintain conversational state across turns. The frontend chat experience is built as a React-based AI interface that consumes this API, keeping the interaction simple for users while orchestration happens server-side.
Early Adoption and Next Steps
PerfInsights is still in its early stages of development.
Today, it’s used primarily by the YugabyteDB performance team, with growing interest from internal product, support, and engineering teams who want insights for planning, escalations, and historical context. Whilst not yet ready for mass adoption, each iteration makes the system more useful and trustworthy.
We expect usage to grow naturally as coverage expands, explanations improve, and workflows become more tightly integrated.
Not Perfect Yet (and That’s Okay!)
PerfInsights is already useful, but we are actively improving it in certain areas.
One challenge is choosing the right amount of context. Some questions need narrow, precise data. Others benefit from broader historical comparisons. Today, the system can sometimes retrieve too much or too little context, depending on how the question is phrased.
Another ongoing effort is keeping the vector store up to date. As new releases and workloads are added, embeddings need to be updated so that the system can reason over current, relevant data.
These aren’t blockers. They’re the normal signs of a system evolving through real-world use.
Despite these limitations, PerfInsights has already reduced friction, improved cross-team communication, and made performance data far easier to understand.
Conclusion
Bringing AI into the performance workflow isn’t a quick fix or instant solution, but it did help resolve two key issues:
- Too many graphs to review
- Too much performance data (which was hard to interpret)
The new tools, the Autonomous Regression Analyst AI agent and PerfInsights, have reduced manual effort and streamlined day-to-day performance work. This means less time spent scanning charts and more time spent understanding what actually changed and why.
These systems are still developing and aren’t (yet) perfect. They also need regular tuning as benchmarks and workloads change. It’s important to clarify that these systems are not a replacement for human judgment and oversight. They simply take care of the repetitive tasks, allowing the team to focus on in-depth analysis and make more informed decisions.
Our goal is straightforward: to ensure that performance data is easy to understand, instantly available to act on, and accessible to anyone who relies on it. We’re excited to see how the technology evolves as we utilize it to harness the power of performance data!
Want to know how the YugabyteDB performance team tests distributed PostgreSQL for performance and scalability? Check out this blog, which provides a deep dive into the comprehensive testing framework.


