Monitoring YugabyteDB with Prometheus and Grafana in Kubernetes
March 11, 2020
Prometheus has matured into a robust time-series metrics monitoring solution since it was first open-sourced in 2012. CNCF incubated it as its second project after Kubernetes in 2016 followed by graduation in 2018. Today it is arguably the most popular option for monitoring Kubernetes cluster metrics as well as container-based applications. Combined with Grafana for visualization, it becomes a potent combination for dashboarding performance of applications. Nodes in a YugabyteDB cluster have exposed a Prometheus endpoint for easy metrics collection right from the inception of the open source project. Yugabyte Platform and Yugabyte Cloud, Yugabyte’s two commercial DBaaS offerings, have extensive monitoring features built on Prometheus.
In this blog post, we will review how you can include Prometheus and Grafana capabilities in your deployed environment. All of the components we will discuss are 100% open source and can be used either in an on-prem or public cloud-based environment.
What’s YugabyteDB? It is an open source, high-performance distributed SQL database built on a scalable and fault-tolerant design inspired by Google Spanner. The Yugabyte SQL API, YSQL, is wire-protocol compatible with PostgreSQL so that developers can easily build new cloud native applications without learning a new database language.
Prometheus can be stood up in a Kubernetes cluster using either the Kubernetes prometheus-operator or a straightforward yaml manifest. For example consider this yaml excerpt:
spec:
    containers:
    - name: prometheus
      image: prom/prometheus:v2.15.2
      imagePullPolicy: Always
      ports:
        - containerPort: 9090
          protocol: TCP
      volumeMounts:
        - mountPath: "/etc/prometheus"
          name: config-prometheus
The above would launch a single Prometheus container which leverages a simple Prometheus configuration. The full Prometheus yaml is provided for reference here. The configuration for Prometheus needs to have scrape targets identified to pull metrics from and their endpoints. For example:
apiVersion: v1
kind: ConfigMap
metadata:
 name: prometheus-config
 namespace: yb-demo
data:
 prometheus.yml: |
  global:
  scrape_configs:
- job_name: 'yugabytedb'
metrics_path: /prometheus-metrics
    static_configs:
      - targets: ['yb-master-0.yb-masters.yb-demo.svc.cluster.local:7000', 'yb-master-1.yb-masters.yb-demo.svc.cluster.local:7000', 'yb-master-2.yb-masters.yb-demo.svc.cluster.local:7000']
        labels:
          group: 'yb-master'
The above Prometheus config specifically identifies the source nodes, ports, and path for obtaining metrics from the master YugabyteDB nodes. The entire yaml example is here.
The Grafana deployment is similarly simple and straightforward. Grafana consists of another single container specified in a yaml manifest:
spec:
      containers:
      - name: grafana
        image: grafana/grafana
        ports:
        - containerPort: 3000
          protocol: TCP
        volumeMounts:
        - mountPath: /var/lib/grafana
          name: grafana-storage
        env:
        - name: GF_SERVER_HTTP_PORT
          value: "3000"
        - name: GF_SECURITY_ADMIN_PASSWORD
          value: "admin"
        - name: GF_INSTALL_PLUGINS
          value: "grafana-kubernetes-app"
      volumes:
      - name: grafana-storage
        emptyDir: {}
The source file is here. You could supplement this with a persistent volume like this:
apiVersion: v1
kind: PersistentVolumeClaim
metadata:
  creationTimestamp: null
  labels:
    component: grafana
  name: grafana-claim
  namespace: yb-demo
spec:
  accessModes:
  - ReadWriteOnce
  resources:
    requests:
      storage: 10Gi
With Grafana as the visualization component, you can expose this via a service load-balancer:
apiVersion: v1
kind: Service
metadata:
  name: grafana-service
  namespace: yb-demo
spec:
  type: LoadBalancer
  selector:
    app: grafana
  ports:
  - protocol: TCP
    port: 3000
    targetPort: 3000
Getting Started with Prometheus, Grafana, and YugabyteDB
An application that you can monitor across the entire stack is the YugabyteDB-powered microservices demo Hipster Shop. Proceed with standing up the YugabyteDB and HipsterShop demo as documented here.
Now it’s one step to deploy both Prometheus and Grafana from the included monitoring directory.
kubectl create -f monitoring/
kubectl get svc
grafana-service         LoadBalancer   10.0.7.82     35.239.65.174   3000:32386/TCP                                 15m
You should be able to view the Grafana login page via a web browser on port 3000 of the indicated IP.
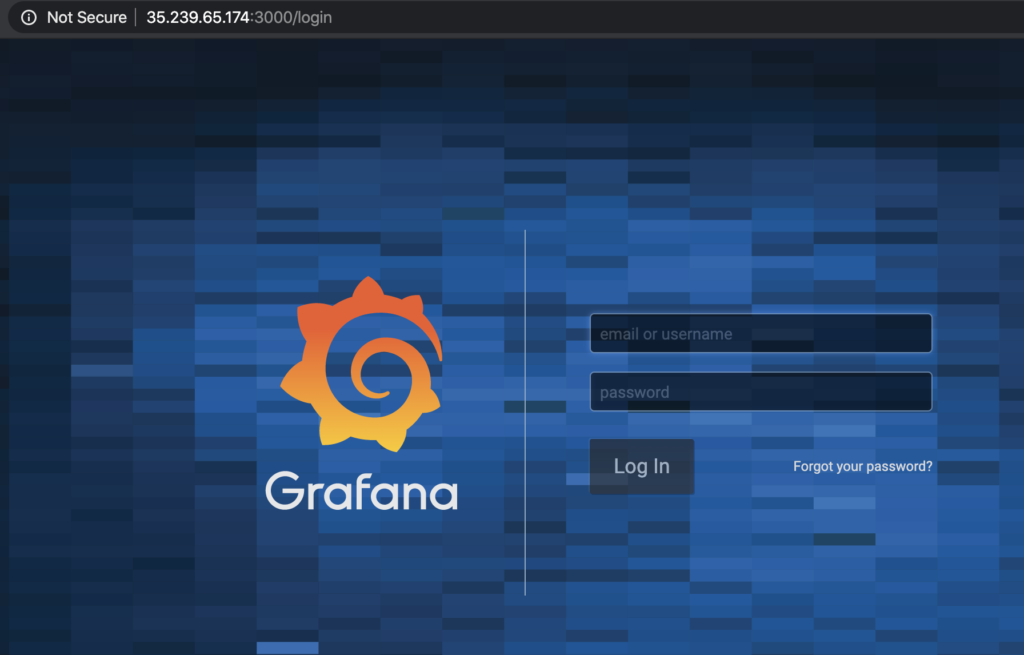
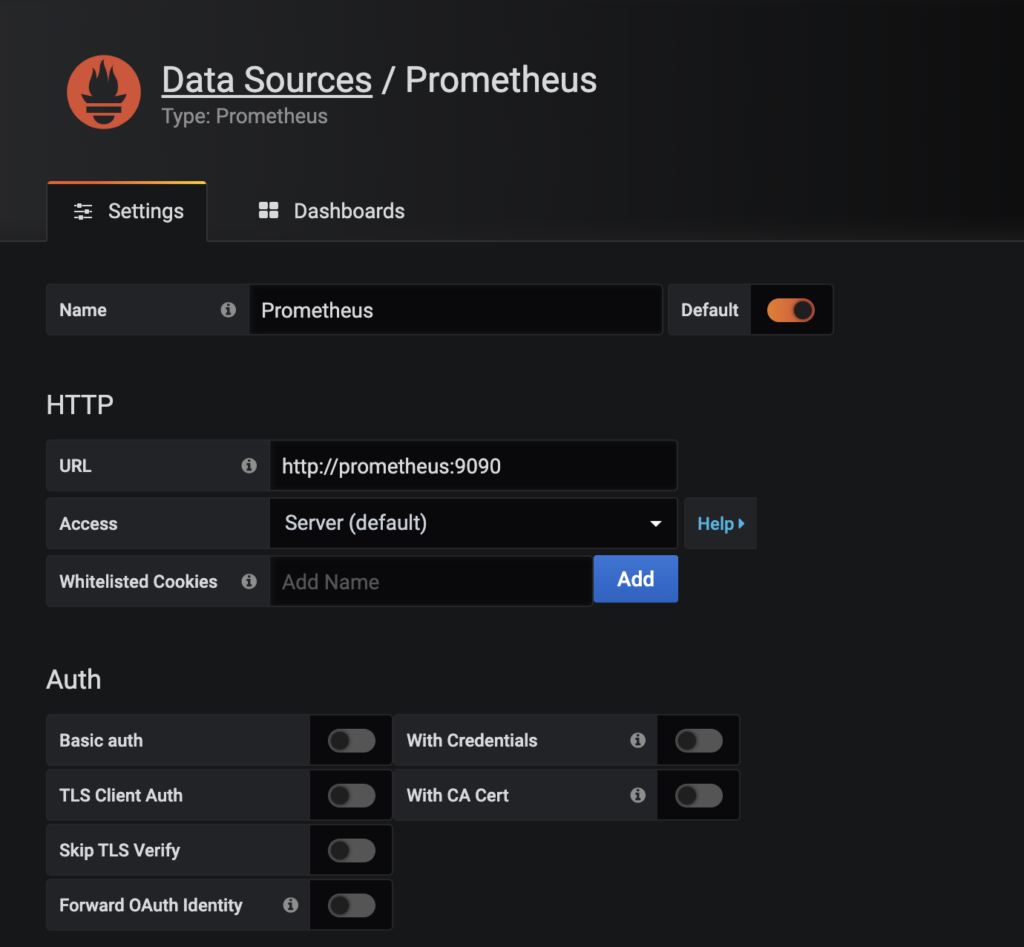
The default credentials are admin/admin. You will be asked if you want to change the admin password which you can do after initial login. Now you can identify the Prometheus data source from its headless service name in Kubernetes.
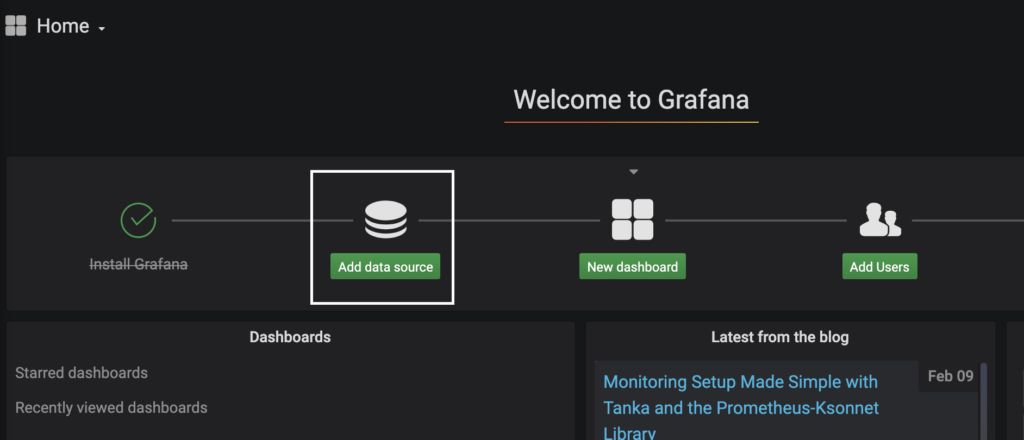
kubectl get svc |grep prom
prometheus              ClusterIP      10.0.5.150              9090/TCP                                       19m
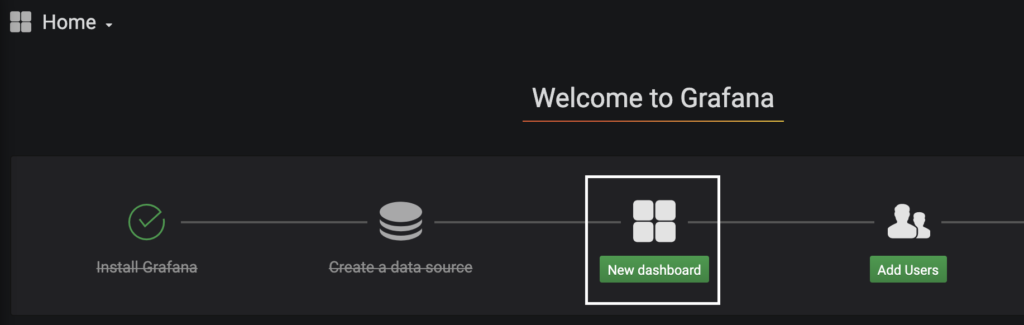
Now we can add in a dashboard to view our metrics:
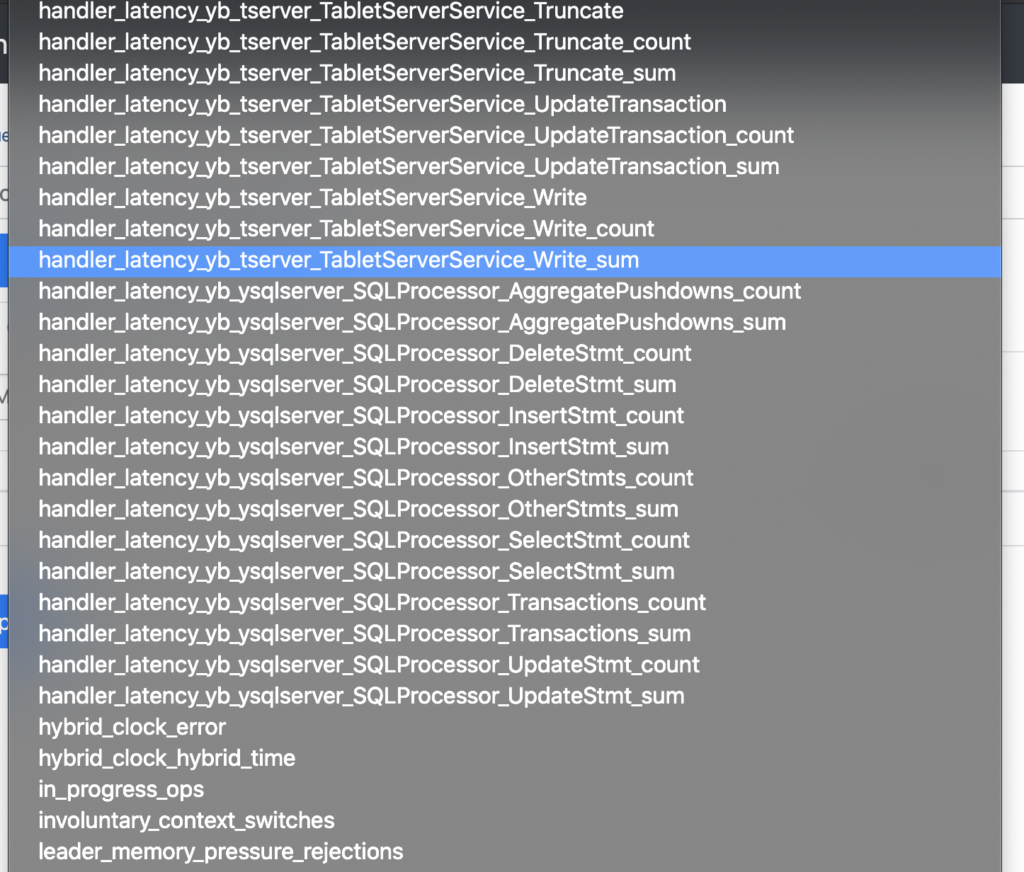
Setting up the static scrape targets gives you access to the YugabyteDB metrics from Master and Tserver. For example:
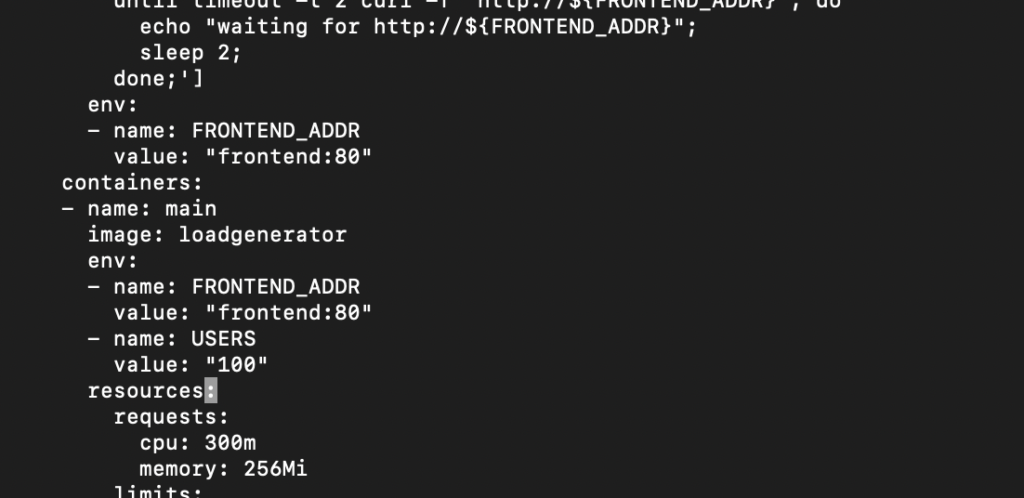
Now if we want to generate traffic to our YugabyteDB instance, we can leverage the loadgenerator service that is part of the HipsterShop deployment. You can edit the users in the kubernetes-manifests/loadgenerator.yaml:
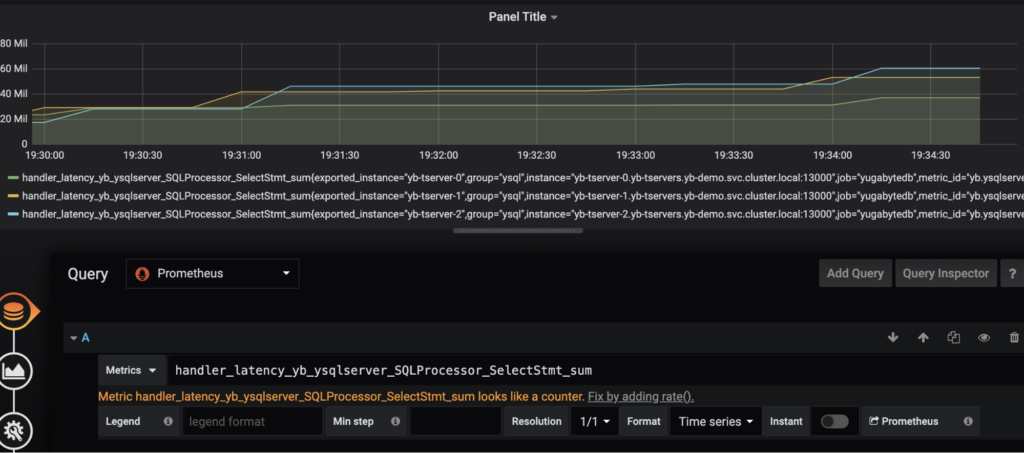
Now when we deploy the HipsterShop, we’ll see the activity reflected in our dashboard. For example, if we are looking for the select statements, we can use handler_latency_yb_ysqlserver_SQLProcessor_SelectStmt_sum.
Selecting this metric we will be able to see the number of select statements across the 3 Tservers in our deployment.
You can also look at Write IOPS with:
sum(irate(handler_latency_yb_ysqlserver_SQLProcessor_InsertStmt_count[1m]))
Or read latency:
avg(irate(handler_latency_yb_ysqlserver_SQLProcessor_SelectStmt_sum[1m])) /
avg(irate(handler_latency_yb_ysqlserver_SQLProcessor_SelectStmt_count[1m]))
Or write latency:
avg(irate(handler_latency_yb_ysqlserver_SQLProcessor_InsertStmt_sum[1m])) /
avg(irate(handler_latency_yb_ysqlserver_SQLProcessor_InsertStmt_count[1m]))
Another way to generate a synthetic workload is with our sample apps repo from here. For example:
kubectl run --image=yugabytedb/yb-sample-apps --restart=Never java-client -- --workload SqlInserts --nodes $YSQL_IP --num_threads_write 1 --num_threads_read 4 -- value_size 4096
For other examples, please check out our observability page here.
See It in Action
Check out the demo video on getting started with monitoring YugabyteDB with Prometheus and Grafana to see it in action:
Future Work
Building on the above effort, we would like to monitor the kube-state-metrics of the Kubernetes cluster as well as the metrics of other Prometheus compatible services. This would leverage published dashboards for Grafana available here. We would also like to centralize our monitoring of multiple Prometheus instances via CNCF’s Cortex project.


